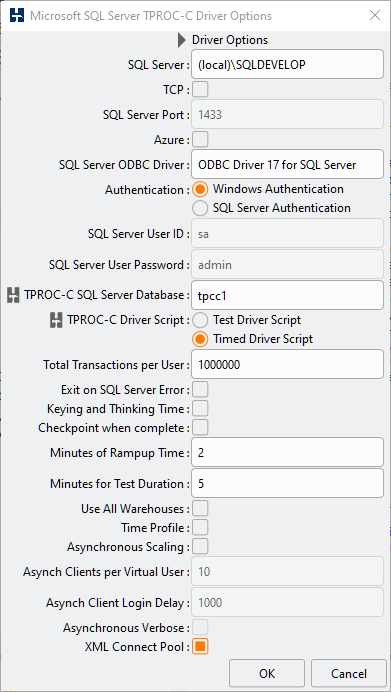
This section includes advanced driver script options intended for expert usage. These options can be used independently or simultaneously for advanced testing scenarios.
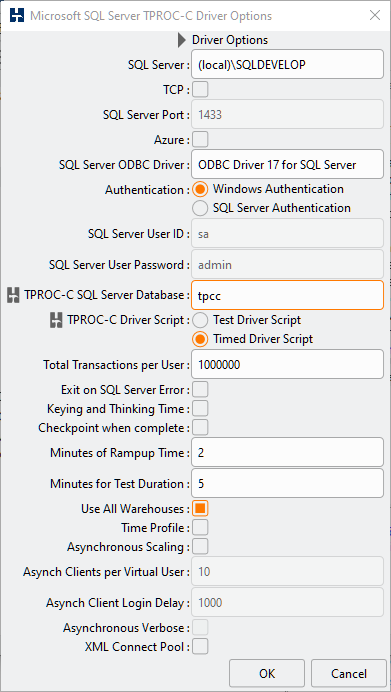
By default each Virtual User will select one home warehouse at random and keep that home warehouse for the duration of a run meaning the majority of its workload will take place on a single warehouse. This means that when running for example 10 Virtual Users most of the workload will take place on 10 warehouses regardless of whether 100, 1000 or 10,000 are configured in the schema. Use All Warehouses is an option that enables increased I/O to the database data area by assigning all of the warehouses in the schema to the Virtual Users in turn. The Virtual Users will then select a new warehouse for each transaction. Consequently this means that the schema size impacts on the overall level of performance placing a great emphasis on I/O. To select this option check the Use All Warehouses check-box.
On running the workload it can now be seen that the Virtual Users will evenly assign the available warehouses between them.
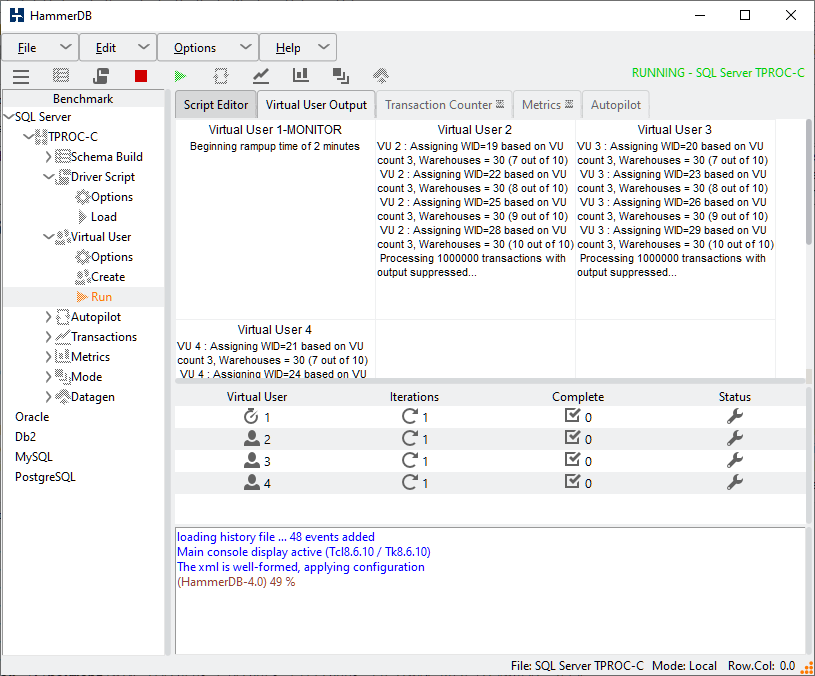
The listing shows an example of a schema with 30 warehouses and 3 Virtual Users. This approach is particularly applicable when testing I/O capabilities for database.
Vuser 1:Beginning rampup time of 2 minutes
Vuser 2:Assigned 10 WIDs = 1 4 7 10 13 16 19 22 25 28 based on VU count 3, Warehouses = 10 out of 30
Vuser 2:Processing 10000000 transactions with output suppressed...
Vuser 3:Assigned 10 WIDs = 2 5 8 11 14 17 20 23 26 29 based on VU count 3, Warehouses = 10 out of 30
Vuser 3:Processing 10000000 transactions with output suppressed...
Vuser 4:Assigned 10 WIDs = 3 6 9 12 15 18 21 24 27 30 based on VU count 3, Warehouses = 10 out of 30
Vuser 4:Processing 10000000 transactions with output suppressed...
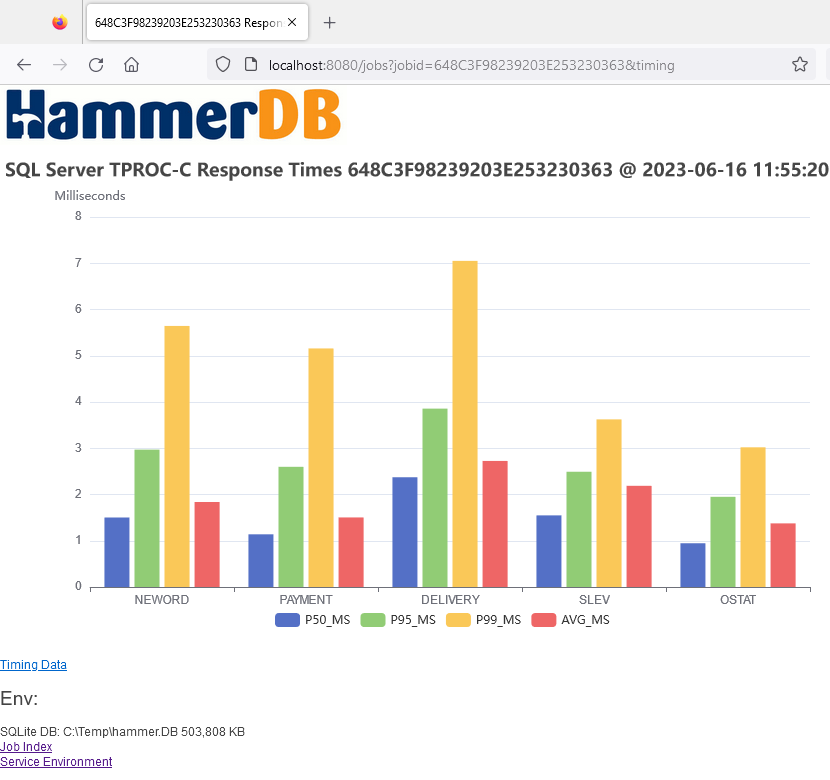
In addition to performance profiles based on throughput you should also take note of transaction response times. Whereas performance profiles show the cumulative performance of all of the virtual users running on the system, response times show performance based on the experience of the individual user. When comparing systems both throughput and response time are important comparative measurements.
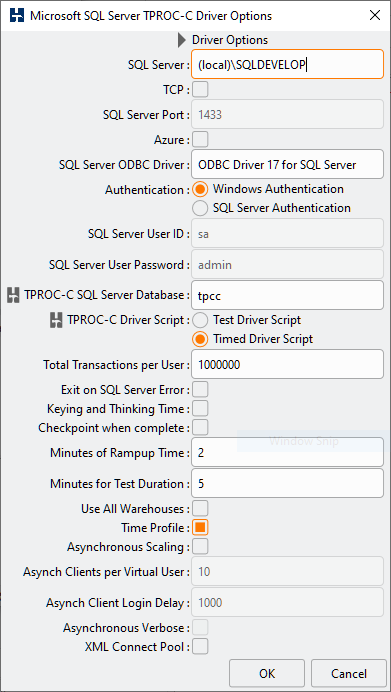
Time Profile functionality is enabled by selecting the Time Profile checkbox in the driver options for the GUI or setting the database prefix specific timeprofile option to true in the CLI.
The time profiling package is called xtprof and is set in the generic.xml configuration. The additional option xt_reservoir determines the number of samples to collect for time profiling data. When set to 0 all samples are gathered.
    <timeprofile>
           <profiler>xtprof</profiler>
           <xt_unique_log_name>0</xt_unique_log_name>
           <xt_gather_timeout>60</xt_gather_timeout>
           <xt_job_storage>1</xt_job_storage>
           <xt_reservoir>10000</xt_reservoir>
    </timeprofile>
When xtprof is selected HammerDB will collect time profiling data for all active virtual users. At the end of the run after the performance has been reported all of the data will be gathered, calculated and appended to a logfile called hdbxtprofile.log or if a unique log name is used for example a log name such as hdbxtprofile_607407EE586C03E293732393.log. Measured overhead for profiling all of the virtual users is expected to be up to 2% of the throughput. Calculations take place after the test has run and will therefore not impact the performance measurements. Time profiling takes place in memory and records the timings for every transaction for every virtual user and therefore for long running tests can be expected to consume large amounts of memory.
The xt_gather_timeout option sets a user configurable value in minutes for the time for HammerDB to wait for Virtual Users to report timings when event driven scaling is used with many 1000's of sessions. In this scenario xt_gather_timeout defines how long to wait for the Virtual User timing report until proceeding to the calculation. If no Virtual Users have reported an error is printed, if a subset of the Virtual Users have reported a timing report is printed for those Virtual Users that did report.
Vuser 1:Test complete, Taking end Transaction Count.
Vuser 1:5 VU * 10 AC = 50 Active Sessions configured
Vuser 1:TEST RESULT : System achieved 53 NOPM from 399 PostgreSQL TPM
Vuser 1:Gathering timing data from Active Virtual Users...
Vuser 4:All asynchronous clients complete
Vuser 5:All asynchronous clients complete
Vuser 3:All asynchronous clients complete
Vuser 2:All asynchronous clients complete
Vuser 1:WARNING:Timing Data Incomplete
Vuser 1:4 out of 5 Virtual Users reported
Vuser 1:Writing timing data to /tmp/hdbxtprofile.log
Within the logfile HammerDB will report for all Active Virtual Users meaning the first Virtual User will be 2 as Virtual User 1 is the monitor. The report will also provide a summary of all Active Virtual Users. Note that for the summary the total time will be for all virtual users and therefore will be equivalent to the running time multiplied by the virtual user count.
Table 4.8. Xt Time Profile
| Value | Description |
|---|---|
| CALLS | Number of times that the stored procedure was called. |
| MIN | Minimum response time in milliseconds. |
| AVG | Average response time in milliseconds. |
| MAX | Maximum response time in milliseconds. |
| TOTAL | Total time spent in that stored procedure during the measuring interval. The total time will include both rampup and timed test times. |
| P99 | 99th percentile in milliseconds. |
| P75 | 75th percentile in milliseconds. |
| P95 | 95th percentile in milliseconds. |
| P50 | 50th percentile in milliseconds. |
| P25 | 25th percentile in milliseconds. |
| SD | Standard Deviation showing variance in captured values. |
| RATIO | Ratio showing percentage time taken for that stored procedure. The total of these values may be less than 100% as only timings for the stored procedures are shown. |
an example xt time profile report is shown.
+-+-+-+-+-+-+-+-+-+-+-+-+-+-+-+-+-+-+-+-+-+-+-+-+-+-+-+-+-+-+-+-+-+-+-+-+-+
PostgreSQL HammerDB Time Profile Report @ Tue Jun 23 16:03:54 BST 2026
+-+-+-+-+-+-+-+-+-+-+-+-+-+-+-+-+-+-+-+-+-+-+-+-+-+-+-+-+-+-+-+-+-+-+-+-+-+
>>>>> VIRTUAL USER 2 : ELAPSED TIME : 419775ms
>>>>> PROC: NEWORD
CALLS: 656700    MIN: 0.164ms    AVG: 0.295ms    MAX: 12.313ms    TOTAL: 193566.895ms
P99: 0.529ms    P95: 0.387ms    P75: 0.321ms    P50: 0.286ms    P25: 0.253ms    SD: 0.148ms    RATIO: 46.112%
>>>>> PROC: PAYMENT
CALLS: 658053    MIN: 0.075ms    AVG: 0.168ms    MAX: 67.505ms    TOTAL: 110242.787ms
P99: 0.285ms    P95: 0.238ms    P75: 0.188ms    P50: 0.162ms    P25: 0.140ms    SD: 0.040ms    RATIO: 26.262%
>>>>> PROC: DELIVERY
CALLS: 65718     MIN: 0.397ms    AVG: 0.634ms    MAX: 11.137ms    TOTAL: 41644.855ms
P99: 0.992ms    P95: 0.855ms    P75: 0.689ms    P50: 0.608ms    P25: 0.553ms    SD: 0.115ms    RATIO: 9.921%
>>>>> PROC: SLEV
CALLS: 65996     MIN: 0.266ms    AVG: 0.624ms    MAX: 419.205ms   TOTAL: 41192.806ms
P99: 0.821ms    P95: 0.696ms    P75: 0.573ms    P50: 0.500ms    P25: 0.441ms    SD: 5.496ms    RATIO: 9.813%
>>>>> PROC: OSTAT
CALLS: 65605     MIN: 0.053ms    AVG: 0.147ms    MAX: 2.893ms     TOTAL: 9640.839ms
P99: 0.257ms    P95: 0.210ms    P75: 0.165ms    P50: 0.142ms    P25: 0.122ms    SD: 0.040ms    RATIO: 2.297%
+-+-+-+-+-+-+-+-+-+-+-+-+-+-+-+-+-+-+-+-+-+-+-+-+-+-+-+-+-+-+-+-+-+-+-+-+-+
>>>>> VIRTUAL USER 3 : ELAPSED TIME : 419290ms
>>>>> PROC: NEWORD
CALLS: 654605    MIN: 0.163ms    AVG: 0.296ms    MAX: 67.379ms    TOTAL: 193641.889ms
P99: 0.545ms    P95: 0.393ms    P75: 0.322ms    P50: 0.286ms    P25: 0.253ms    SD: 0.168ms    RATIO: 46.183%
>>>>> PROC: PAYMENT
CALLS: 654048    MIN: 0.074ms    AVG: 0.168ms    MAX: 16.239ms    TOTAL: 110188.450ms
P99: 0.296ms    P95: 0.237ms    P75: 0.188ms    P50: 0.162ms    P25: 0.140ms    SD: 0.045ms    RATIO: 26.280%
>>>>> PROC: DELIVERY
CALLS: 65761     MIN: 0.393ms    AVG: 0.636ms    MAX: 4.272ms     TOTAL: 41829.132ms
P99: 0.992ms    P95: 0.857ms    P75: 0.692ms    P50: 0.610ms    P25: 0.554ms    SD: 0.123ms    RATIO: 9.976%
>>>>> PROC: SLEV
CALLS: 65348     MIN: 0.262ms    AVG: 0.629ms    MAX: 430.422ms   TOTAL: 41107.043ms
P99: 0.821ms    P95: 0.701ms    P75: 0.578ms    P50: 0.508ms    P25: 0.447ms    SD: 2.323ms    RATIO: 9.804%
>>>>> PROC: OSTAT
CALLS: 65518     MIN: 0.067ms    AVG: 0.148ms    MAX: 2.194ms     TOTAL: 9699.309ms
P99: 0.257ms    P95: 0.210ms    P75: 0.166ms    P50: 0.143ms    P25: 0.124ms    SD: 0.036ms    RATIO: 2.313%
+-+-+-+-+-+-+-+-+-+-+-+-+-+-+-+-+-+-+-+-+-+-+-+-+-+-+-+-+-+-+-+-+-+-+-+-+-+
>>>>> VIRTUAL USER 4 : ELAPSED TIME : 418812ms
>>>>> PROC: NEWORD
CALLS: 670116    MIN: 0.164ms    AVG: 0.296ms    MAX: 67.262ms    TOTAL: 198091.983ms
P99: 0.541ms    P95: 0.390ms    P75: 0.321ms    P50: 0.286ms    P25: 0.253ms    SD: 0.139ms    RATIO: 47.299%
>>>>> PROC: PAYMENT
CALLS: 670459    MIN: 0.075ms    AVG: 0.168ms    MAX: 14.863ms    TOTAL: 112632.335ms
P99: 0.292ms    P95: 0.237ms    P75: 0.186ms    P50: 0.161ms    P25: 0.140ms    SD: 0.042ms    RATIO: 26.893%
>>>>> PROC: DELIVERY
CALLS: 66445     MIN: 0.403ms    AVG: 0.626ms    MAX: 13.347ms    TOTAL: 41591.732ms
P99: 0.979ms    P95: 0.839ms    P75: 0.683ms    P50: 0.605ms    P25: 0.550ms    SD: 0.113ms    RATIO: 9.931%
>>>>> PROC: SLEV
CALLS: 67023     MIN: 0.256ms    AVG: 0.502ms    MAX: 10.721ms    TOTAL: 33647.333ms
P99: 0.764ms    P95: 0.668ms    P75: 0.554ms    P50: 0.489ms    P25: 0.435ms    SD: 0.098ms    RATIO: 8.034%
>>>>> PROC: OSTAT
CALLS: 66821     MIN: 0.056ms    AVG: 0.147ms    MAX: 2.200ms     TOTAL: 9807.417ms
P99: 0.263ms    P95: 0.210ms    P75: 0.165ms    P50: 0.141ms    P25: 0.122ms    SD: 0.040ms    RATIO: 2.342%
+-+-+-+-+-+-+-+-+-+-+-+-+-+-+-+-+-+-+-+-+-+-+-+-+-+-+-+-+-+-+-+-+-+-+-+-+-+
>>>>> VIRTUAL USER 5 : ELAPSED TIME : 418541ms
>>>>> PROC: NEWORD
CALLS: 657082    MIN: 0.163ms    AVG: 0.295ms    MAX: 67.948ms    TOTAL: 194054.029ms
P99: 0.541ms    P95: 0.392ms    P75: 0.321ms    P50: 0.285ms    P25: 0.253ms    SD: 0.065ms    RATIO: 46.364%
>>>>> PROC: PAYMENT
CALLS: 657694    MIN: 0.073ms    AVG: 0.168ms    MAX: 12.848ms    TOTAL: 110348.724ms
P99: 0.289ms    P95: 0.237ms    P75: 0.187ms    P50: 0.161ms    P25: 0.140ms    SD: 0.113ms    RATIO: 26.365%
>>>>> PROC: DELIVERY
CALLS: 66125     MIN: 0.399ms    AVG: 0.631ms    MAX: 13.956ms    TOTAL: 41718.562ms
P99: 0.983ms    P95: 0.854ms    P75: 0.689ms    P50: 0.606ms    P25: 0.550ms    SD: 0.117ms    RATIO: 9.968%
>>>>> PROC: SLEV
CALLS: 65926     MIN: 0.276ms    AVG: 0.622ms    MAX: 415.994ms   TOTAL: 40992.258ms
P99: 0.813ms    P95: 0.694ms    P75: 0.572ms    P50: 0.497ms    P25: 0.441ms    SD: 5.314ms    RATIO: 9.794%
>>>>> PROC: OSTAT
CALLS: 65621     MIN: 0.058ms    AVG: 0.148ms    MAX: 9.016ms     TOTAL: 9720.789ms
P99: 0.266ms    P95: 0.211ms    P75: 0.166ms    P50: 0.143ms    P25: 0.124ms    SD: 0.057ms    RATIO: 2.323%
+-+-+-+-+-+-+-+-+-+-+-+-+-+-+-+-+-+-+-+-+-+-+-+-+-+-+-+-+-+-+-+-+-+-+-+-+-+
>>>>> SUMMARY OF 4 ACTIVE VIRTUAL USERS : MEDIAN ELAPSED TIME : 419051ms
>>>>> PROC: NEWORD
CALLS: 2638503   MIN: 0.163ms    AVG: 0.295ms    MAX: 67.948ms    TOTAL: 779354.659ms
P99: 0.542ms    P95: 0.391ms    P75: 0.321ms    P50: 0.285ms    P25: 0.253ms    SD: 0.068ms    RATIO: 46.495%
>>>>> PROC: PAYMENT
CALLS: 2640254   MIN: 0.073ms    AVG: 0.168ms    MAX: 67.505ms    TOTAL: 443412.218ms
P99: 0.292ms    P95: 0.237ms    P75: 0.187ms    P50: 0.162ms    P25: 0.140ms    SD: 0.043ms    RATIO: 26.453%
>>>>> PROC: DELIVERY
CALLS: 264049    MIN: 0.393ms    AVG: 0.632ms    MAX: 13.956ms    TOTAL: 166784.252ms
P99: 0.983ms    P95: 0.853ms    P75: 0.690ms    P50: 0.608ms    P25: 0.552ms    SD: 0.118ms    RATIO: 9.950%
>>>>> PROC: SLEV
CALLS: 264293    MIN: 0.256ms    AVG: 0.594ms    MAX: 430.422ms   TOTAL: 156939.420ms
P99: 0.806ms    P95: 0.689ms    P75: 0.568ms    P50: 0.497ms    P25: 0.440ms    SD: 4.516ms    RATIO: 9.363%
>>>>> PROC: OSTAT
CALLS: 263565    MIN: 0.053ms    AVG: 0.147ms    MAX: 9.016ms     TOTAL: 38868.348ms
P99: 0.255ms    P95: 0.209ms    P75: 0.166ms    P50: 0.142ms    P25: 0.122ms    SD: 0.037ms    RATIO: 2.319%
When Jobs are enabled by default the time profile data will be stored alongside the Jobid and can be viewed with the web service. Charts are automatically generated to show the response times based on the summary of the median values of all virtual users.
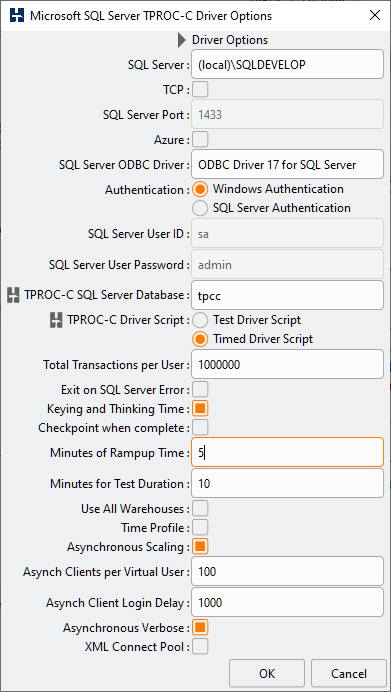
Event driven scaling enables the scaling of virtual users to thousands of sessions running with keying and thinking time enabled. This feature adds additional benefit to your testing scenarios with the ability to handle large numbers of connections or testing with connection pooling. When running transactional workloads with HammerDB the default mode is CPU intensive meaning that one virtual user will run as many transactions as possible without keying and thinking time enabled. When keying and thinking time is enabled there is a large time delay both before and after running a transaction meaning that each Virtual User will spend most of its time idle. However creating a very large number of Virtual Users requires a significant use of load test generation server resources. Consequently event driven scaling is a feature that enables each Virtual User to create multiple database sessions and manage the keying and thinking time for each asynchronously in an event-driven loop enabling HammerDB to create a much larger session count within an existing Virtual User footprint. It should be clear that this feature is only designed to work with keying and thinking time enabled as it is only the keying and thinking time that is managed asynchronously.
To configure this feature select Asynchronous Scaling noting that Keying and Thinking Time is automatically selected. Select a number of Asynch Clients per Virtual User and set the Asynch Login Delay in milliseconds. This Login Delay means that each client will wait for this time after the previous client has logged in before then logging in itself. For detailed output select Asynchronous Verbose. Note that with this feature it is important to allow the clients enough time to both login fully before measuring performance and also at the end it will take additional time for the clients to all complete their current keying and thinking time and to exit before the Virtual User reports all clients as complete.
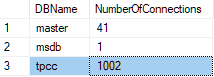
When all Virtual Users have logged in (example from SQL Server) the session count will show as the number of Virtual Users multiplied by the Asynchronous Clients.
SELECT DB_NAME(dbid) as DBName, COUNT(dbid) as NumberOfConnections FROM sys.sysprocesses WHERE dbid > 0 GROUP BY dbid;
As each Asynchronous Client logs in it will be reported in the Virtual User output.
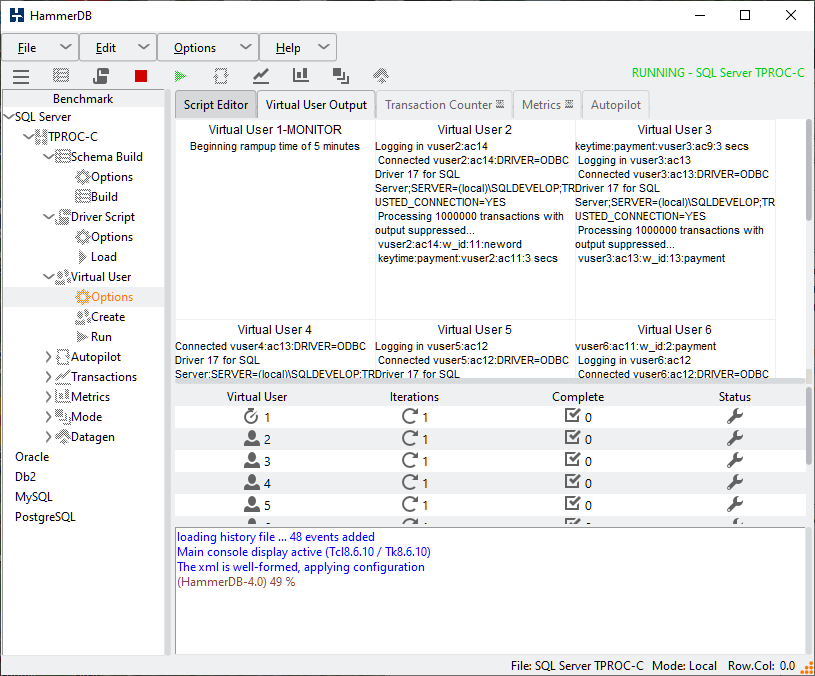
When the workload is running with Asynchronous Verbose enabled HammerDB will report the events as they happen.
With either logging enabled, or jobs output enabled and Asynchronous Verbose HammerDB will report the events as they happen for each Virtual User such as when they enter keying or thinking time and when they process a transaction.
  "keytime:ostat:vuser22:ac2:2 secs",
  "80",
  "vuser80:ac1:w_id:14:payment",
  "75",
  "thinktime:delivery:vuser75:ac7:23 secs",
  "75",
  "vuser75:ac7:w_id:2:neword",
  "98",
  "keytime:neword:vuser98:ac5:18 secs",
  "43",
  "keytime:neword:vuser43:ac6:18 secs",
  "68",
  "keytime:neword:vuser68:ac4:18 secs",
  "28",
  "keytime:neword:vuser28:ac5:18 secs",
  "12",
  "thinktime:neword:vuser12:ac1:28 secs",
  "12",
  "vuser12:ac1:w_id:2:neword",
  "23",
  "keytime:neword:vuser23:ac7:18 secs",
  "23",
  "thinktime:neword:vuser23:ac7:0 secs",
  "23",
  "vuser23:ac7:w_id:26:neword",
  "88",
  "keytime:delivery:vuser88:ac4:2 secs",
  "41",
  "keytime:neword:vuser41:ac7:18 secs",
  "24",
  "keytime:neword:vuser24:ac9:18 secs",
  "69",
  "keytime:neword:vuser69:ac3:18 secs",
  "99",
  "keytime:neword:vuser99:ac8:18 secs",
  "2",
  "keytime:ostat:vuser2:ac10:2 secs",
  "94",
  "keytime:neword:vuser94:ac6:18 secs",
  "66",
  "keytime:neword:vuser66:ac1:18 secs",
  "66",
  "thinktime:neword:vuser66:ac1:0 secs",
  "66",
  "vuser66:ac1:w_id:8:neword",
  "80",
  "keytime:neword:vuser80:ac4:18 secs",
  "65",
  "keytime:neword:vuser65:ac8:18 secs",
  "76",
  "keytime:neword:vuser76:ac8:18 secs",
  "19",
  "keytime:neword:vuser19:ac3:18 secs",
  "20",
  "thinktime:delivery:vuser20:ac7:2 secs",
  "8",
  "thinktime:payment:vuser8:ac4:10 secs",
  "20",
  "vuser20:ac7:w_id:1:payment",
  "8",
  "vuser8:ac4:w_id:7:payment",
  "79",
  "thinktime:payment:vuser79:ac10:4 secs",
  "2",
  "thinktime:payment:vuser2:ac7:20 secs",
  "79",
  "vuser79:ac10:w_id:25:payment",
  "12",
  "thinktime:ostat:vuser12:ac4:8 secs",
  "2",
  "vuser2:ac7:w_id:27:neword",
  "12",
  "vuser12:ac4:w_id:15:neword",
  "37",
  "keytime:neword:vuser37:ac6:18 secs",
  "23",
  "thinktime:neword:vuser23:ac4:2 secs",
  "23",
  "vuser23:ac4:w_id:4:payment",
  "57",
  "thinktime:neword:vuser57:ac8:15 secs",
  "60",
  "keytime:neword:vuser60:ac10:18 secs",
  "57",
  "vuser57:ac8:w_id:6:neword",
  "24",
  "keytime:delivery:vuser24:ac1:2 secs",
  "28",
  "thinktime:payment:vuser28:ac3:11 secs",
  "28",
  "vuser28:ac3:w_id:13:payment",
  "4",
  "keytime:neword:vuser4:ac1:18 secs",
  "33",
  "thinktime:payment:vuser33:ac10:1 secs",
  "52",
  "thinktime:neword:vuser52:ac4:34 secs",
  "33",
  "vuser33:ac10:w_id:17:neword",
  "52",
  "vuser52:ac4:w_id:13:payment",
  "86",
  "thinktime:delivery:vuser86:ac3:10 secs",
  "86",
  "vuser86:ac3:w_id:16:delivery",
  "69",
  "thinktime:payment:vuser69:ac5:26 secs",
  "46",
  "thinktime:payment:vuser46:ac2:11 secs",
  "69",
  "vuser69:ac5:w_id:28:slev",
  "46",
  "vuser46:ac2:w_id:28:payment",
  "33",
  "keytime:neword:vuser33:ac6:18 secs",
  "31",
  "keytime:neword:vuser31:ac9:18 secs",
  "100",
  "thinktime:payment:vuser100:ac6:37 secs",
  "100",
  "vuser100:ac6:w_id:12:neword",
  "52",
  "thinktime:payment:vuser52:ac8:8 secs",
  "52",
  "vuser52:ac8:w_id:20:payment",
  "69",
  "thinktime:payment:vuser69:ac6:1 secs",
  "12",
  "thinktime:payment:vuser12:ac8:25 secs",
  "69",
  "vuser69:ac6:w_id:15:payment",
  "12",
  "vuser12:ac8:w_id:4:payment",
  "27",
  "keytime:neword:vuser27:ac3:18 secs",
  "77",
  "thinktime:neword:vuser77:ac9:76 secs",
  "77",
  "vuser77:ac9:w_id:11:neword",
  "47",
  "thinktime:neword:vuser47:ac1:12 secs",
  "47",
  "vuser47:ac1:w_id:18:payment",
  "77",
  "thinktime:payment:vuser77:ac1:10 secs",
  "77",
  "vuser77:ac1:w_id:6:neword",
  "101",
  "thinktime:payment:vuser101:ac7:7 secs",
  "6",
  "thinktime:neword:vuser6:ac9:7 secs",
  "101",
  "vuser101:ac7:w_id:30:neword",
  "6",
  "vuser6:ac9:w_id:22:payment",
  "42",
  "thinktime:neword:vuser42:ac2:8 secs",
  "42",
  "vuser42:ac2:w_id:21:neword",
  "24",
  "keytime:neword:vuser24:ac4:18 secs",
  "73",
  "thinktime:neword:vuser73:ac9:3 secs",
  "49",
  "thinktime:payment:vuser49:ac7:25 secs",
  "73",
  "vuser73:ac9:w_id:25:payment",
  "49",
  "vuser49:ac7:w_id:30:payment",
  "52",
  "thinktime:neword:vuser52:ac6:21 secs",
  "52",
  "vuser52:ac6:w_id:26:payment",
  "101",
  "keytime:payment:vuser101:ac8:3 secs",
  "3",
  "keytime:ostat:vuser3:ac10:2 secs",
  "10",
  "keytime:payment:vuser10:ac2:3 secs",
  "82",
  "thinktime:payment:vuser82:ac5:5 secs",
  "100",
  "keytime:payment:vuser100:ac7:3 secs",
  "82",
  "vuser82:ac5:w_id:24:payment",
  "63",
  "keytime:payment:vuser63:ac4:3 secs",
  "52",
  "thinktime:neword:vuser52:ac7:3 secs",
  "52",
  "vuser52:ac7:w_id:30:neword",
  "49",
  "keytime:payment:vuser49:ac2:3 secs",
  "56",
  "thinktime:payment:vuser56:ac5:16 secs",
  "56",
  "vuser56:ac5:w_id:21:neword",
  "9",
  "keytime:neword:vuser9:ac9:18 secs",
  "3",
  "keytime:neword:vuser3:ac4:18 secs",
  "2",
  "keytime:neword:vuser2:ac2:18 secs",
  "80",
  "keytime:payment:vuser80:ac2:3 secs",
  "90",
  "keytime:neword:vuser90:ac3:18 secs",
  "9",
  "thinktime:neword:vuser9:ac9:0 secs",
  "98",
  "thinktime:payment:vuser98:ac10:29 secs",
  "94",
  "keytime:payment:vuser94:ac1:3 secs",
  "89",
  "keytime:slev:vuser89:ac10:2 secs",
  "9",
  "vuser9:ac9:w_id:10:payment",
  "98",
  "vuser98:ac10:w_id:14:payment",
  "53",
  "thinktime:payment:vuser53:ac9:10 secs",
  "5",
  "thinktime:payment:vuser5:ac3:10 secs",
  "53",
  "vuser53:ac9:w_id:28:payment",
  "5",
  "vuser5:ac3:w_id:13:payment",
  "63",
  "keytime:neword:vuser63:ac7:18 secs",
  "92",
  "thinktime:payment:vuser92:ac6:23 secs",
  "92",
  "vuser92:ac6:w_id:3:neword",
  "3",
  "keytime:ostat:vuser3:ac6:2 secs",
  "30",
  "keytime:neword:vuser30:ac7:18 secs",
  "55",
  "keytime:payment:vuser55:ac5:3 secs",
  "84",
  "keytime:neword:vuser84:ac2:18 secs",
  "32",
  "thinktime:payment:vuser32:ac2:19 secs",
  "32",
  "vuser32:ac2:w_id:23:neword",
  "82",
  "thinktime:neword:vuser82:ac8:7 secs",
  "85",
  "thinktime:neword:vuser85:ac2:19 secs",
  "82",
  "vuser82:ac8:w_id:10:delivery",
  "85",
  "vuser85:ac2:w_id:22:neword",
  "57",
  "thinktime:payment:vuser57:ac4:2 secs",
  "57",
  "vuser57:ac4:w_id:10:delivery",
  "93",
One particular advantage of this type of workload is to be able to run a fixed throughput test defined by the number of Virtual Users.
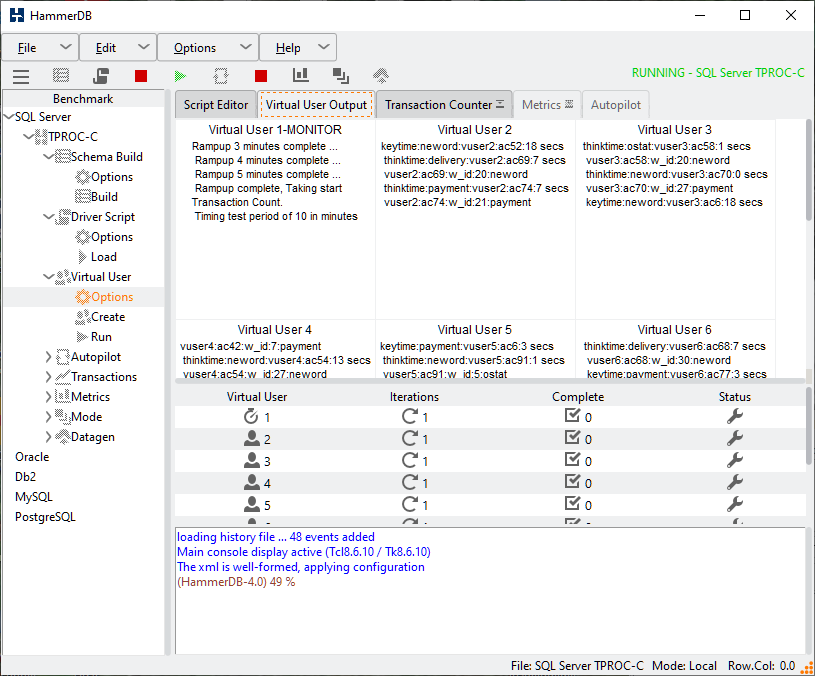
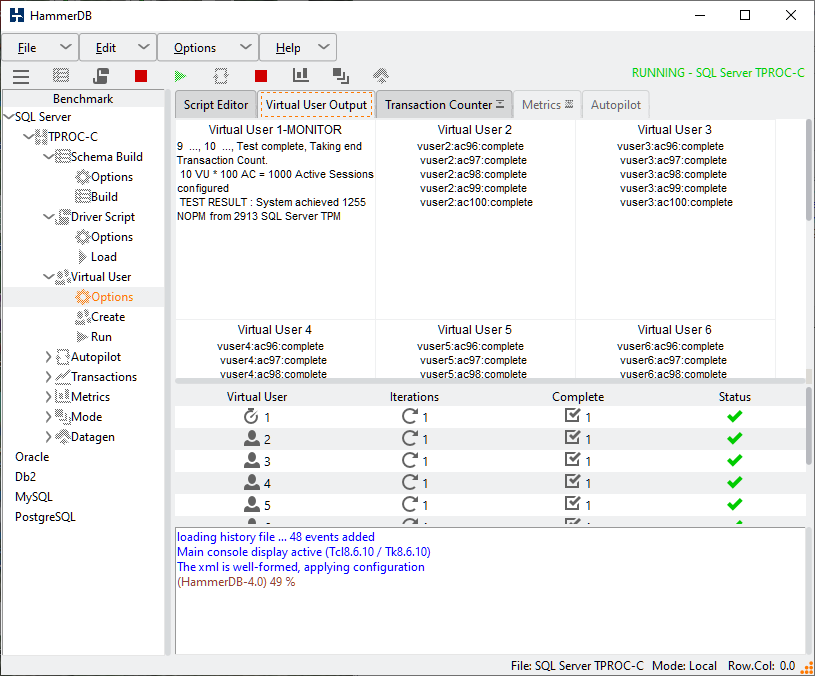
On completion of the workloads the Monitor Virtual User will report the number of Active Sessions and the performance achieved. The active Virtual Users will report when all of the asynchronous clients have completed their workloads and logged off. As shown timing can also be enabled for asynchronous workloads.
The event driven scaling feature is an effective test methodology for testing middle tier or proxy systems or where fixed throughput testing is required.
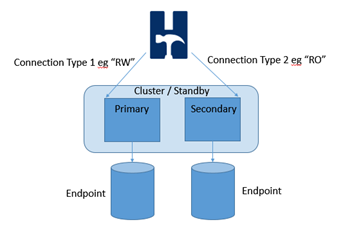
The Cluster Connect Pool is intended for simultaneously testing related multiple instances of a clustered database. It enables each Virtual User to open a pool of connections (Note that each virtual user (or asynchronous client) will open and hold all of the defined connections) and direct the individual transactions to run on a specific instance according to a pre-defined policy. With this approach it is possible for example to direct the read-write transactions to a primary instance on a cluster whilst directing the read-only transactions to the secondary.
Note that for testing or evaluation of this feature it is also possible to direct one HammerDB client to test multiple separate instances at the same time provided that the instances have exactly the same warehouse count as shown in the example below. However for a valid and comparable test consistency should be ensured between the database instances. Therefore for example directing transactions against any instance in an Oracle RAC configuration would be valid as would running the read only transactions against a secondary read only instance in a cluster. However running against separate unrelated instances is possible for testing but not comparable for performance results. The monitor virtual user will continue to connect to the instance defined in the driver options and report NOPM and TPM from this standalone connection only and therefore the reliance is on the database to accurately report a cluster wide transactions and for the instances to have the same warehouse count. Nevertheless when using the XML connect pooling a client side transaction count will also be reported to provide detailed transaction data from all Virtual Users.
The configuration is defined in the database-specific XML file in the config/connpool directory. It is recommended to make a backup of the file before it is modified. The XML configuration file is in 2 sections, connections and sprocs. For connections the XML configuration file should be modified according to the cluster database names with each connection defined by the tags c1, c2, c3 respectively. There is no restriction to the number of connections that you define. Under the sprocs section in the XML configuration file is defined which stored procedures will use which connections and what policy is to be used. The policy can be first_named, last_named, random or round_robin. For example with connections c1, c2 and c3 for neworder and a policy of round_robin the first neworder transaction would execute against connection c1, the second c2, the third c3, the fourth c1 and so on. For all databases and all stored procedures prepared statements are used meaning that a statement is prepared for each connection for each virtual user and a reference kept for that prepared statement for execution.
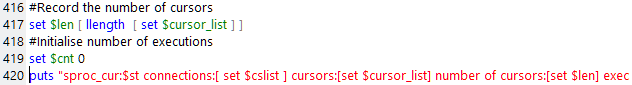
For further information on the connections opened there is a commented information line in the driver script such as #puts "sproc_cur:$st connections:[ set $cslist ] cursors:[set $cursor_list] number of cursors:[set $len] execs:[set $cnt]" prior to the opening of the standalone connection that may be uncommented for more detail when the script is run.
<connpool>
<connections>
    <c1>
        <mssqls_server>(local)\SQLDEVELOP</mssqls_server>
        <mssqls_linux_server>host1</mssqls_linux_server>
        <mssqls_tcp>false</mssqls_tcp>
        <mssqls_port>1433</mssqls_port>
        <mssqls_azure>false</mssqls_azure>
        <mssqls_authentication>windows</mssqls_authentication>
        <mssqls_linux_authent>sql</mssqls_linux_authent>
<mssqls_odbc_driver>ODBC Driver 17 for SQL Server</mssqls_odbc_driver>
<mssqls_linux_odbc>ODBC Driver 17 for SQL Server</mssqls_linux_odbc>
        <mssqls_uid>sa</mssqls_uid>
        <mssqls_pass>admin</mssqls_pass>
<mssqls_dbase>tpcc1</mssqls_dbase>
    </c1>
    <c2>
        <mssqls_server>(local)\SQLDEVELOP</mssqls_server>
        <mssqls_linux_server>host2</mssqls_linux_server>
        <mssqls_tcp>false</mssqls_tcp>
        <mssqls_port>1433</mssqls_port>
        <mssqls_azure>false</mssqls_azure>
        <mssqls_authentication>windows</mssqls_authentication>
        <mssqls_linux_authent>sql</mssqls_linux_authent>
<mssqls_odbc_driver>ODBC Driver 17 for SQL Server</mssqls_odbc_driver>
<mssqls_linux_odbc>ODBC Driver 17 for SQL Server</mssqls_linux_odbc>
        <mssqls_uid>sa</mssqls_uid>
        <mssqls_pass>admin</mssqls_pass>
<mssqls_dbase>tpcc2</mssqls_dbase>
    </c2>
    <c3>
        <mssqls_server>(local)\SQLDEVELOP</mssqls_server>
        <mssqls_linux_server>host3</mssqls_linux_server>
        <mssqls_tcp>false</mssqls_tcp>
        <mssqls_port>1433</mssqls_port>
        <mssqls_azure>false</mssqls_azure>
        <mssqls_authentication>windows</mssqls_authentication>
        <mssqls_linux_authent>sql</mssqls_linux_authent>
<mssqls_odbc_driver>ODBC Driver 17 for SQL Server</mssqls_odbc_driver>
<mssqls_linux_odbc>ODBC Driver 17 for SQL Server</mssqls_linux_odbc>
        <mssqls_uid>sa</mssqls_uid>
        <mssqls_pass>admin</mssqls_pass>
<mssqls_dbase>tpcc3</mssqls_dbase>
    </c3>
</connections>
<sprocs>
  <neworder>
<connections>c1 c2 c3</connections>
    <policy>round_robin</policy>
</neworder>
    <payment>
<connections>c1 c2</connections>
    <policy>first_named</policy>
</payment>
    <delivery>
<connections>c2 c3</connections>
    <policy>last_named</policy>
</delivery>
    <stocklevel>
<connections>c1 c2 c3</connections>
    <policy>random</policy>
</stocklevel>
    <orderstatus>
<connections>c2 c3</connections>
    <policy>round_robin</policy>
</orderstatus>
</sprocs>
</connpool>
After modifying the XML configuration file select XML Connect Pool in the Driver Options to activate this feature.
For this example the additional information for the comments is also added to illustrate the connections made.
When the Virtual Users are run the logfile shows that connections are made for the active Virtual Users according to the connections and policies defined in the XML configuration file. Also prepared statements are created and held in a pool for execution against the defined policy. Also note that the standalone connection "tpcc1" is also made to monitor the transaction rates and define the warehouse count for the run.
Vuser 2:sproc_cur:neword_st connections:{odbcc1 odbcc2 odbcc3} cursors:::oo::Obj23::Stmt::3 ::oo::Obj28::Stmt::3 ::oo::Obj33::Stmt::3 number of cursors:3 execs:0
Vuser 2:sproc_cur:payment_st connections:{odbcc1 odbcc2} cursors:::oo::Obj23::Stmt::4 ::oo::Obj28::Stmt::4 number of cursors:2 execs:0
Vuser 2:sproc_cur:ostat_st connections:{odbcc2 odbcc3} cursors:::oo::Obj28::Stmt::5 ::oo::Obj33::Stmt::4 number of cursors:2 execs:0
Vuser 2:sproc_cur:delivery_st connections:{odbcc1 odbcc2 odbcc3} cursors:::oo::Obj23::Stmt::5 ::oo::Obj28::Stmt::6 ::oo::Obj33::Stmt::5 number of cursors:3 execs:0
Vuser 2:sproc_cur:slev_st connections:{odbcc2 odbcc3} cursors:::oo::Obj28::Stmt::7 ::oo::Obj33::Stmt::6 number of cursors:2 execs:0
Vuser 3:sproc_cur:neword_st connections:{odbcc1 odbcc2 odbcc3} cursors:::oo::Obj23::Stmt::3 ::oo::Obj28::Stmt::3 ::oo::Obj33::Stmt::3 number of cursors:3 execs:0
Vuser 3:sproc_cur:payment_st connections:{odbcc1 odbcc2} cursors:::oo::Obj23::Stmt::4 ::oo::Obj28::Stmt::4 number of cursors:2 execs:0
Vuser 3:sproc_cur:ostat_st connections:{odbcc2 odbcc3} cursors:::oo::Obj28::Stmt::5 ::oo::Obj33::Stmt::4 number of cursors:2 execs:0
Vuser 3:sproc_cur:delivery_st connections:{odbcc1 odbcc2 odbcc3} cursors:::oo::Obj23::Stmt::5 ::oo::Obj28::Stmt::6 ::oo::Obj33::Stmt::5 number of cursors:3 execs:0
Vuser 3:sproc_cur:slev_st connections:{odbcc2 odbcc3} cursors:::oo::Obj28::Stmt::7 ::oo::Obj33::Stmt::6 number of cursors:2 execs:0
On completion of the run the NOPM and TPM is recorded. This is the area where it is of particular importance to be aware of the database and cluster configuration for the results to be consistent. It is therefore valid to reiterate that if the cluster and standalone connection does not record all of the transactions in the cluster then the NOPM results will only be returned for the standalone connection. By way of example in the test configuration shown there are 3 separate databases and the standalone connection is made to tpcc1. Therefore the test results shows the NOPM value at approximately 1/3rd of the ratio expected against the TPM value that records all of the transactions against the SQL Server. For this reason the CLIENT SIDE TPM is also shown. In this example the neworder value per minute is 78319 a close equivalent to 3 x 26207 and therefore gives an indication of the NOPM value for multiple instances in a non-cluster configuration. In this case 3 connections were made to tpcc1, tpcc2 and tpcc3 and the connections chosen to round robin between them, therefore the actual number of NOPM is 3X that recorded from just the standalone connection. In a correctly configured cluster environment it would be the same and the results wouyld be both consistent and valid. Be aware that these client side values are recorded during both rampup and timed test periods and therefore may not accurately reflect the results from a valid timed test.
Vuser 1:2 Active Virtual Users configured
Vuser 1:TEST RESULT : System achieved 26207 NOPM from 180515 SQL Server TPM
Vuser 1:CLIENT SIDE TPM : neworder 78319 payment 78185 delivery 7855 stocklevel 7826 orderstatus 7809
In addition to the CLIENT SIDE TPM each Virtual User will also report the total number of transactions that it processed from the time that it started running to the end of the test.
Vuser 2:VU2 processed neworder 275335 payment 273822 delivery 27495 stocklevel 27588 orderstatus 27568 transactions
Vuser 3:VU3 processed neworder 272901 payment 273475 delivery 27493 stocklevel 27194 orderstatus 27097 transactions
The XML Connect Pool feature provides advanced features for the expert user to test clusters and multiple instances simultaneously, it also gives the user a high degree of control on how this is used, therefore it is at the users discretion to use these settings appropriately to ensure consistent results.
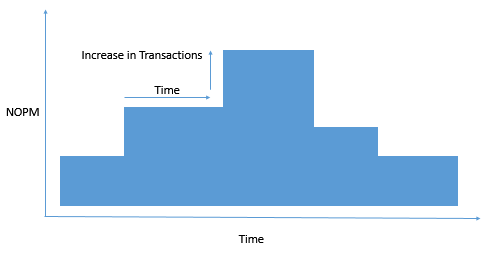
Step testing is methodology of varying the load on the database over a period time. In HammerDB this variable load us achieved by automating the Remote Primary and Replica modes functionality. As the primary will automatically create and connect a number of replicas this functionality is available only when using the CLI and is started using the steprun command. Designing the steps is best approached by considering each horizontal block a primary or replica level with the primary at the base and the replicas at subsequent steps. Note that with a variable load the number of NOPM or TPM recorded over time is less relevant than for a non-variable timed test as the number of transactions will vary throughout the test. Instead this approach is best for capturing changes in response times and transaction rates throughout the test for further analysis such as rapidly finding peak performance in one test by increasing the load and observing the transaction rates.
The base of the steps is the primary configuration and this continues to be configured as normal with time defined by rampup and duration and the number of virtual users with the vuset vu command. The replicas are configured in the steps.xml file in the config directory. For each replica (there is no limit on the number of replicas defined) the configuration takes the time after the previous replica started, the duration to run (with no rampup as the primary has already done the rampup) and the number of virtual users, all other configuration is inherited from the primary.
<steps>
<replica1>
  <start_after_prev>1</start_after_prev>
  <duration>4</duration>
  <virtual_users>2</virtual_users>
 </replica1>
 <replica2>
  <start_after_prev>1</start_after_prev>
  <duration>3</duration>
  <virtual_users>2</virtual_users>
 </replica2>
 <replica3>
  <start_after_prev>1</start_after_prev>
  <duration>2</duration>
  <virtual_users>2</virtual_users>
 </replica3>
 <replica4>
  <start_after_prev>1</start_after_prev>
  <duration>1</duration>
  <virtual_users>2</virtual_users>
 </replica4>
</steps>
When the workload is started it will provide a summary of the configuration.
primary starts immediately, runs rampup for 2 minutes then runs test for 5 minutes with 2 Active VU
replica1 starts 1 minutes after rampup completes and runs test for 4 minutes with 2 Active VU
replica2 starts 1 minutes after previous replica starts and runs test for 3 minutes with 2 Active VU
replica3 starts 1 minutes after previous replica starts and runs test for 2 minutes with 2 Active VU
replica4 starts 1 minutes after previous replica starts and runs test for 1 minutes with 2 Active VU
The configuration must resemble a pyramid configuration with the primary providing the base and running for the longest period of time. If the replicas overrun this base then the step workload will error and exit without running. The default configuration is an example where there is a 2 minute rampup, 5 minute test on the primary, with 3 replicas starting 1 minute after the rampup or previous replicas and then running for 4,3,2 and 1 minute respectively meaning primary and replicas complete at the same time. To start a step workload configure a driver script as normal and instead of vurun call the steprun command.
dbset db mssqls
dbset bm TPC-C
diset connection mssqls_server {(local)\SQLDEVELOP}
diset tpcc mssqls_dbase tpcc
diset tpcc mssqls_total_iterations 10000000
diset tpcc mssqls_driver timed
diset tpcc mssqls_rampup 2
diset tpcc mssqls_duration 5
vuset logtotemp 1
vuset vu 2
steprun
No further intervention is needed and the primary will automatically create, configure and run replica instances of HammerDB at the specified time intervals, with an example from the default shown.
HammerDB CLI v6.0
Copyright © HammerDB Ltd hosted by tpc.org 2019-2026
Type "help" for a list of commands
Initialized Jobs on-disk database C:/Users/smsha/AppData/Local/Temp/hammer.DB using existing tables (110,592 bytes)
hammerdb>print dict
Dictionary Settings for MSSQLServer
connection {
 mssqls_server             = (local)
 mssqls_linux_server       = localhost
 mssqls_tcp                = false
 mssqls_port               = 1433
 mssqls_azure              = false
 mssqls_authentication     = windows
 mssqls_msi_object_id      = null
 mssqls_linux_authent      = sql
 mssqls_odbc_driver        = ODBC Driver 18 for SQL Server
 mssqls_linux_odbc         = ODBC Driver 18 for SQL Server
 mssqls_uid                = sa
 mssqls_pass               = admin
 mssqls_encrypt_connection = true
 mssqls_trust_server_cert  = true
}
tpcc       {
 mssqls_count_ware       = 1
 mssqls_num_vu           = 1
 mssqls_dbase            = tpcc
 mssqls_imdb             = false
 mssqls_bucket           = 1
 mssqls_durability       = SCHEMA_AND_DATA
 mssqls_use_bcp          = true
 mssqls_total_iterations = 10000000
 mssqls_raiseerror       = false
 mssqls_keyandthink      = false
 mssqls_checkpoint       = false
 mssqls_driver           = timed
 mssqls_rampup           = 0
 mssqls_duration         = 1
 mssqls_allwarehouse     = false
 mssqls_timeprofile      = true
 mssqls_async_scale      = false
 mssqls_async_client     = 10
 mssqls_async_verbose    = false
 mssqls_async_delay      = 1000
 mssqls_connect_pool     = false
}

hammerdb>diset tpcc mssqls_rampup 2
Changed tpcc:mssqls_rampup from 0 to 2 for MSSQLServer

hammerdb>diset tpcc mssqls_duration 5
Changed tpcc:mssqls_duration from 1 to 5 for MSSQLServer

hammerdb>print dict
Dictionary Settings for MSSQLServer
connection {
 mssqls_server             = (local)
 mssqls_linux_server       = localhost
 mssqls_tcp                = false
 mssqls_port               = 1433
 mssqls_azure              = false
 mssqls_authentication     = windows
 mssqls_msi_object_id      = null
 mssqls_linux_authent      = sql
 mssqls_odbc_driver        = ODBC Driver 18 for SQL Server
 mssqls_linux_odbc         = ODBC Driver 18 for SQL Server
 mssqls_uid                = sa
 mssqls_pass               = admin
 mssqls_encrypt_connection = true
 mssqls_trust_server_cert  = true
}
tpcc       {
 mssqls_count_ware       = 1
 mssqls_num_vu           = 1
 mssqls_dbase            = tpcc
 mssqls_imdb             = false
 mssqls_bucket           = 1
 mssqls_durability       = SCHEMA_AND_DATA
 mssqls_use_bcp          = true
 mssqls_total_iterations = 10000000
 mssqls_raiseerror       = false
 mssqls_keyandthink      = false
 mssqls_checkpoint       = false
 mssqls_driver           = timed
 mssqls_rampup           = 2
 mssqls_duration         = 5
 mssqls_allwarehouse     = false
 mssqls_timeprofile      = true
 mssqls_async_scale      = false
 mssqls_async_client     = 10
 mssqls_async_verbose    = false
 mssqls_async_delay      = 1000
 mssqls_connect_pool     = false
}

hammerdb>diset tpcc mssqls_timeprofile false
Changed tpcc:mssqls_timeprofile from true to false for MSSQLServer

hammerdb>steprun
primary starts immediately, runs rampup for 2 minutes then runs test for 5 minutes with 2 Active VU
replica1 starts 1 minutes after rampup completes and runs test for 4 minutes with 2 Active VU
replica2 starts 1 minutes after previous replica starts and runs test for 3 minutes with 2 Active VU
replica3 starts 1 minutes after previous replica starts and runs test for 2 minutes with 2 Active VU
replica4 starts 1 minutes after previous replica starts and runs test for 1 minutes with 2 Active VU
Switch from Local
to Primary mode?
Enter yes or no: replied yes
Setting Primary Mode at id : 29248, hostname : raven
Primary Mode active at id : 29248, hostname : raven
Starting 1 replica HammerDB instance
Starting 2 replica HammerDB instance
Starting 3 replica HammerDB instance
Starting 4 replica HammerDB instance
HammerDB CLI v6.0
Copyright © HammerDB Ltd hosted by tpc.org 2019-2026
Type "help" for a list of commands
Doing wait to connect ....
HammerDB CLI v6.0
Copyright © HammerDB Ltd hosted by tpc.org 2019-2026
Type "help" for a list of commands
Primary waiting for all replicas to connect .... 0 out of 4 are connected
HammerDB CLI v6.0
Copyright © HammerDB Ltd hosted by tpc.org 2019-2026
Type "help" for a list of commands
HammerDB CLI v6.0
Copyright © HammerDB Ltd hosted by tpc.org 2019-2026
Type "help" for a list of commands
Initialized Jobs on-disk database C:/Users/smsha/AppData/Local/Temp/hammer.DB using existing tables (110,592 bytes)
Switch from Local
to Replica mode?
Initialized Jobs on-disk database C:/Users/smsha/AppData/Local/Temp/hammer.DB using existing tables (110,592 bytes)
Initialized Jobs on-disk database C:/Users/smsha/AppData/Local/Temp/hammer.DB using existing tables (110,592 bytes)
Switch from Local
to Replica mode?
Switch from Local
to Replica mode?
Enter yes or no: replied yes
Enter yes or no: replied yes
Enter yes or no: replied yes
Setting Replica Mode at id : 25020, hostname : raven
Replica connecting to localhost 29248 : Connection succeeded
Received a new replica connection from host ::1
Setting Replica Mode at id : 15472, hostname : raven
Setting Replica Mode at id : 29212, hostname : raven
Initialized Jobs on-disk database C:/Users/smsha/AppData/Local/Temp/hammer.DB using existing tables (110,592 bytes)
Switch from Local
to Replica mode?
Replica connecting to localhost 29248 : Connection succeeded
Replica connecting to localhost 29248 : Connection succeeded
Received a new replica connection from host ::1
Enter yes or no: replied yes
Received a new replica connection from host ::1
Setting Replica Mode at id : 13640, hostname : raven
New replica joined : {25020 raven}
Replica connecting to localhost 29248 : Connection succeeded
New replica joined : {25020 raven} {29212 raven}
New replica joined : {25020 raven} {29212 raven} {15472 raven}
Received a new replica connection from host ::1
New replica joined : {25020 raven} {29212 raven} {15472 raven} {13640 raven}
Primary call back successful
Primary call back successful
Primary call back successful
Primary call back successful
Switched to Replica mode via callback
Switched to Replica mode via callback
Switched to Replica mode via callback
Switched to Replica mode via callback
Primary waiting for all replicas to connect .... {25020 raven} {29212 raven} {15472 raven} {13640 raven} out of 4 are connected
Primary Received all replica connections {25020 raven} {29212 raven} {15472 raven} {13640 raven}
Database set to MSSQLServer
Database set to MSSQLServer
Database set to MSSQLServer
Database set to MSSQLServer
Database set to MSSQLServer
Setting primary to run 2 virtual users for 5 duration
Value 5 for tpcc:mssqls_duration is the same as existing value 5, no change made
Sending dbset all to 25020 raven
Setting replica1 to start after 1 duration 4 VU count 2, Replica instance is 25020 raven
Sending "diset tpcc mssqls_timeprofile false" to 25020 raven
Value false for tpcc:mssqls_timeprofile is the same as existing value false, no change made
Sending "diset tpcc mssqls_rampup 0" to 25020 raven
Changed tpcc:mssqls_rampup from 2 to 0 for MSSQLServer
Sending "diset tpcc mssqls_duration 4" to 25020 raven
Changed tpcc:mssqls_duration from 5 to 4 for MSSQLServer
Sending "vuset vu 2" to 25020 raven
Sending dbset all to 29212 raven
Setting replica2 to start after 1 duration 3 VU count 2, Replica instance is 29212 raven
Sending "diset tpcc mssqls_timeprofile false" to 29212 raven
Value false for tpcc:mssqls_timeprofile is the same as existing value false, no change made
Sending "diset tpcc mssqls_rampup 0" to 29212 raven
Changed tpcc:mssqls_rampup from 2 to 0 for MSSQLServer
Sending "diset tpcc mssqls_duration 3" to 29212 raven
Changed tpcc:mssqls_duration from 5 to 3 for MSSQLServer
Sending "vuset vu 2" to 29212 raven
Sending dbset all to 15472 raven
Setting replica3 to start after 1 duration 2 VU count 2, Replica instance is 15472 raven
Sending "diset tpcc mssqls_timeprofile false" to 15472 raven
Value false for tpcc:mssqls_timeprofile is the same as existing value false, no change made
Sending "diset tpcc mssqls_rampup 0" to 15472 raven
Changed tpcc:mssqls_rampup from 2 to 0 for MSSQLServer
Sending "diset tpcc mssqls_duration 2" to 15472 raven
Changed tpcc:mssqls_duration from 5 to 2 for MSSQLServer
Sending "vuset vu 2" to 15472 raven
Sending dbset all to 13640 raven
Setting replica4 to start after 1 duration 1 VU count 2, Replica instance is 13640 raven
Sending "diset tpcc mssqls_timeprofile false" to 13640 raven
Value false for tpcc:mssqls_timeprofile is the same as existing value false, no change made
Sending "diset tpcc mssqls_rampup 0" to 13640 raven
Changed tpcc:mssqls_rampup from 2 to 0 for MSSQLServer
Sending "diset tpcc mssqls_duration 1" to 13640 raven
Changed tpcc:mssqls_duration from 5 to 1 for MSSQLServer
Sending "vuset vu 2" to 13640 raven
Script loaded, Type "print script" to view
Script loaded, Type "print script" to view
Script loaded, Type "print script" to view
Script loaded, Type "print script" to view
Script loaded, Type "print script" to view
Vuser 1 created MONITOR - WAIT IDLE
Vuser 1 created MONITOR - WAIT IDLE
Vuser 2 created - WAIT IDLE
Vuser 1 created MONITOR - WAIT IDLE
Vuser 1 created MONITOR - WAIT IDLE
Vuser 1 created MONITOR - WAIT IDLE
Vuser 3 created - WAIT IDLE
Vuser 2 created - WAIT IDLE
Vuser 2 created - WAIT IDLE
Vuser 2 created - WAIT IDLE
Vuser 2 created - WAIT IDLE
Vuser 3 created - WAIT IDLE
3 Virtual Users Created with Monitor VU
Vuser 3 created - WAIT IDLE
Vuser 3 created - WAIT IDLE
Vuser 3 created - WAIT IDLE
Starting Primary VUs
3 Virtual Users Created with Monitor VU
3 Virtual Users Created with Monitor VU
3 Virtual Users Created with Monitor VU
3 Virtual Users Created with Monitor VU
Vuser 1:RUNNING
Vuser 1:DBVersion:16.0.1135.2
Vuser 1:Beginning rampup time of 2 minutes
Vuser 2:RUNNING
Vuser 2:Processing 10000000 transactions with output suppressed...
Vuser 3:RUNNING
Vuser 3:Processing 10000000 transactions with output suppressed...
Delaying Start of Replicas to rampup 2 replica1 1 replica2 1 replica3 1 replica4 1
Delaying replica1 for 3 minutes.
Delaying replica2 for 4 minutes.
Delaying replica3 for 5 minutes.
Delaying replica4 for 6 minutes.
Primary entering loop waiting for vucomplete
Vuser 1:Rampup 1 minutes complete ...
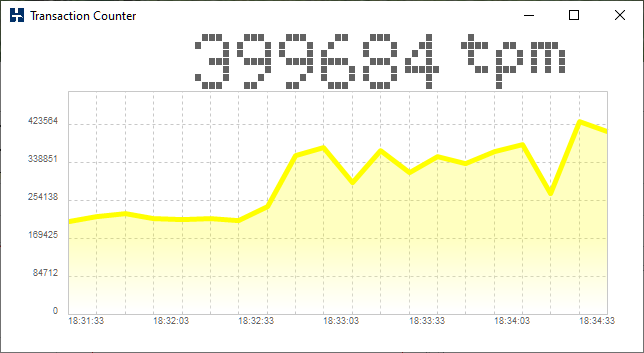
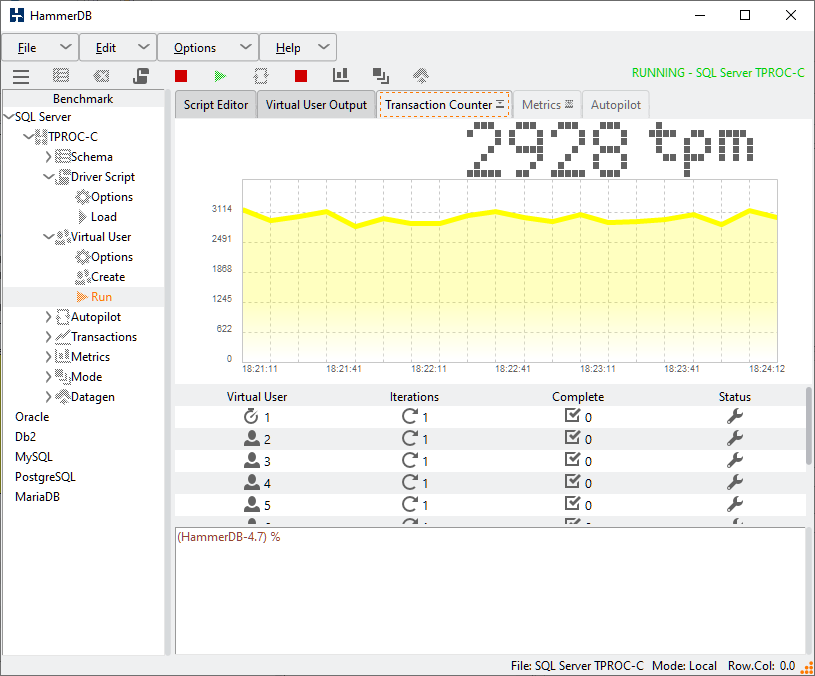
Viewing the GUI or CLI transaction counter the effect can be seen that the load is varied as the replicas are automatically started.