
 One of the key metrics for measuring database performance is CPU utilisation. Therefore since version 2.16 HammerDB has included a CPU monitor in the GUI to graphically observe this utilisation during a workload.
At HammerDB v4.11 the CPU metrics functionality has been enhanced to add the CPU data to the CLI as well as recording this CPU data for HammerDB jobs to view with the HammerDB web service. This post explains the changes to the CPU metrics in HammerDB v4.11 and how to use them.
Capturing CPU utilisation data
HammerDB can record a number of metrics for a workload (such as transaction count and response times) that are stored in the SQLite databases repository for viewing with the web service. HammerDB v4.11 adds the same functionality for the CPU metrics as well as adding a number of commands to the CLI so that the CPU data can be recorded for both.
It is important to note however the distinction between data such as transaction count and CPU utilisation in that the former can be retrieved from the target database with SQL, however the latter requires additional data gathering at the system level. To do this HammerDB uses a separate agent process to gather the CPU utilisation and send it to HammerDB. If HammerDB is running on a separate system to the database being tested, then the agent needs to run on the system where the database is running.
On Linux the HammerDB agent uses the mpstat utility from the sysstat package and therefore this package must be installed on the system being tested.
$ mpstat -V
sysstat version 11.5.7
(C) Sebastien Godard (sysstat <at> orange.fr
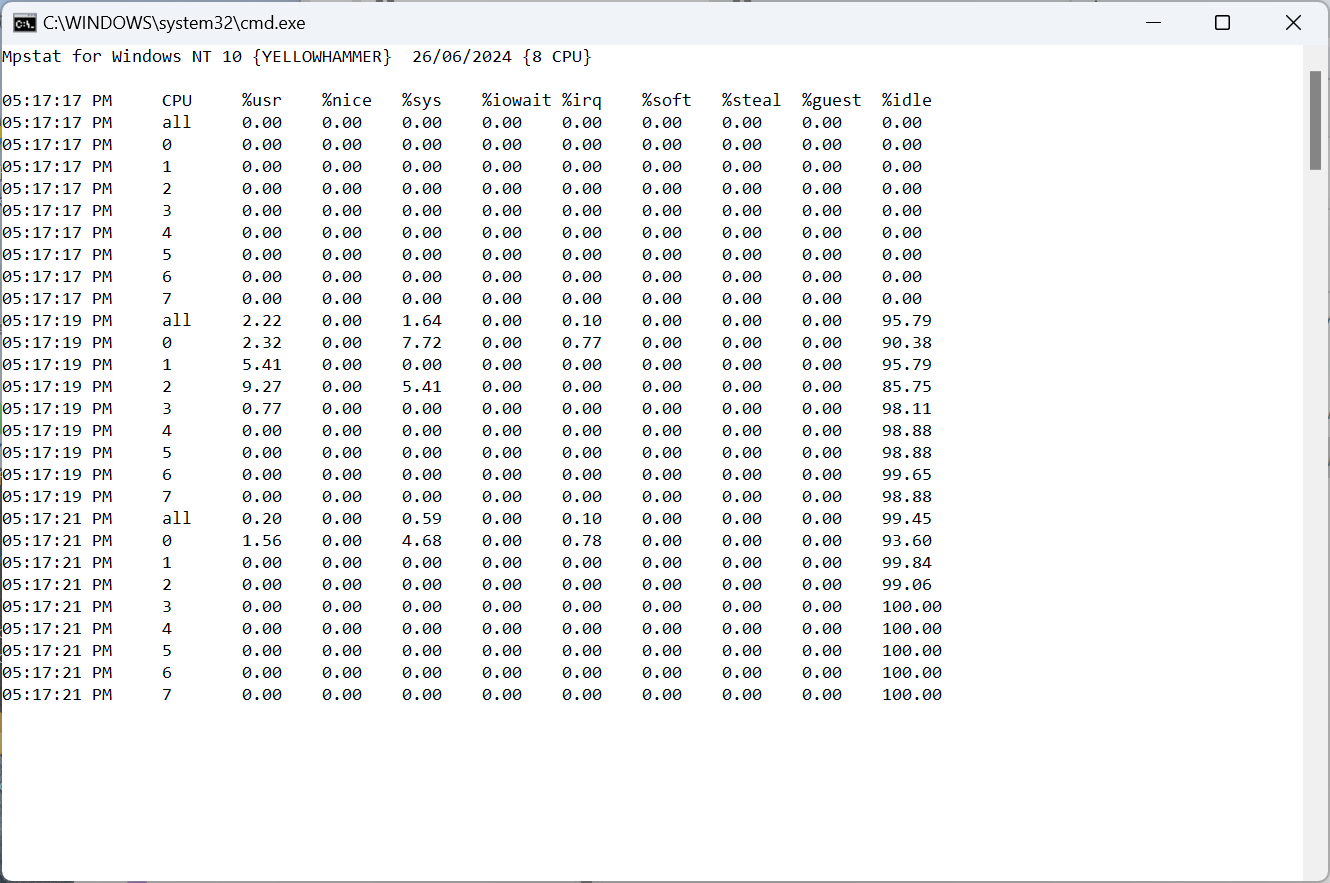
On windows the mpstat utility is provided by HammerDB instead and is installed in the agent directory. This uses the Windows PDH functions to consume the counter data.
If HammerDB is installed on the same system as the database then the agent can be run directly from the HammerDB install. If the database system is separate and HammerDB is connecting over the network then HammerDB should be installed on the database server for running the agent.
Note that you may have already installed HammerDB on both systems as running a schema build locally on the same system will typically be much faster then running a build over the network.
Starting the agent manually
Note that if you are running HammerDB on the same host as the database then you can skip to starting the agent automatically. However the choice is yours, even if the host is the same then you can still follow the manual process of starting the agent and then connecting display that you have to take when the systems are separate.
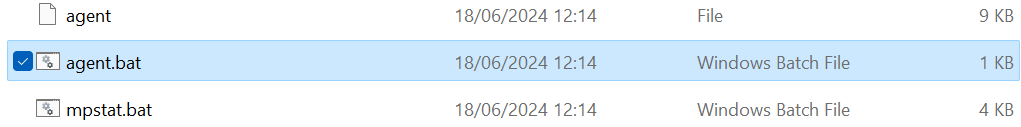
The agent can be started manually by running ./agent on Linux or agent.bat on Windows.
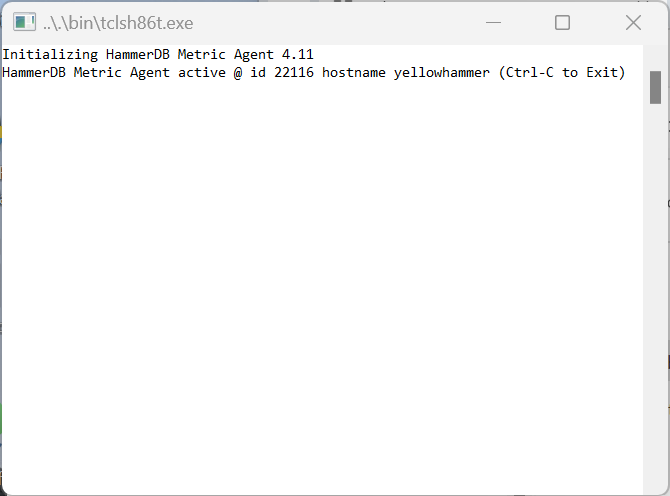
When run without arguments the agent will randomly select a port and report the port and hostname to connect to.
Alternatively, if you provide an argument of a port number to the agent
C:\Program Files\HammerDB-4.11\agent>agent.bat 10000
Then the agent will start with this specified port number
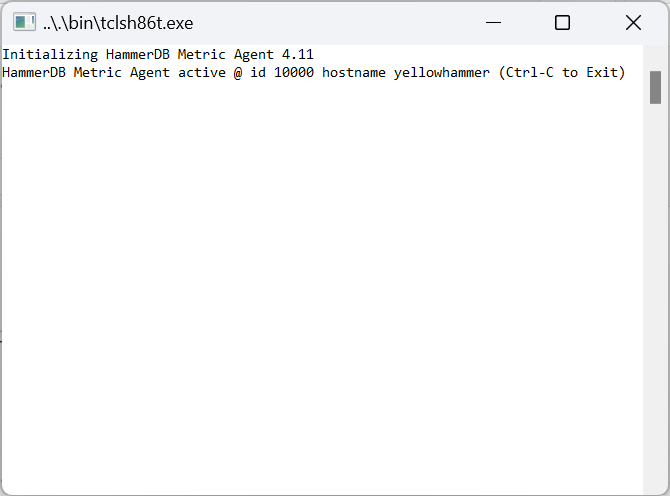
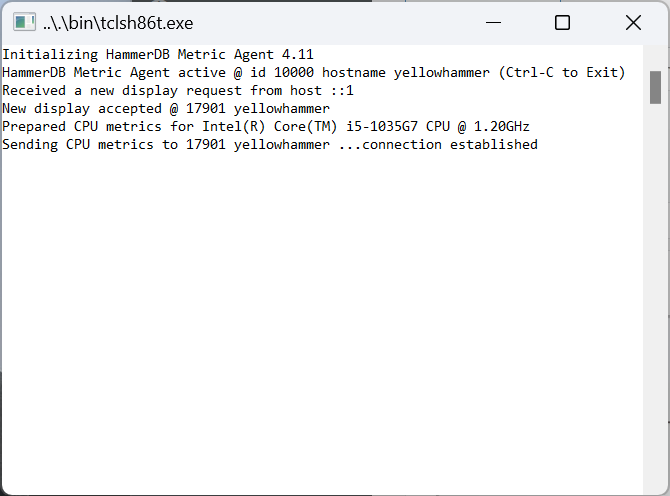
The agent is now ready to be connected to with a display. When connected the agent will run mpstat and gather and send CPU data to the display.
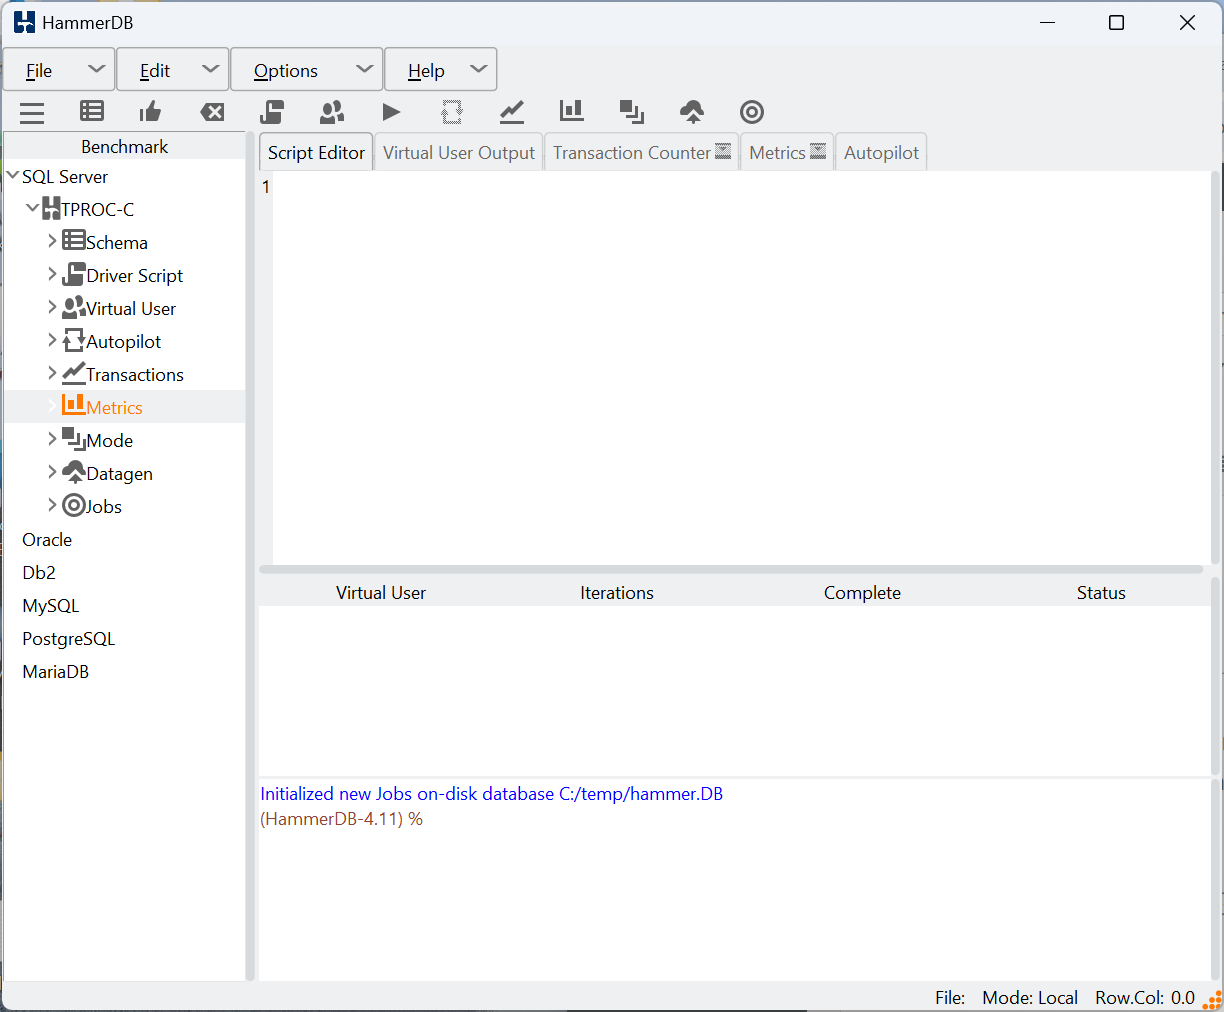
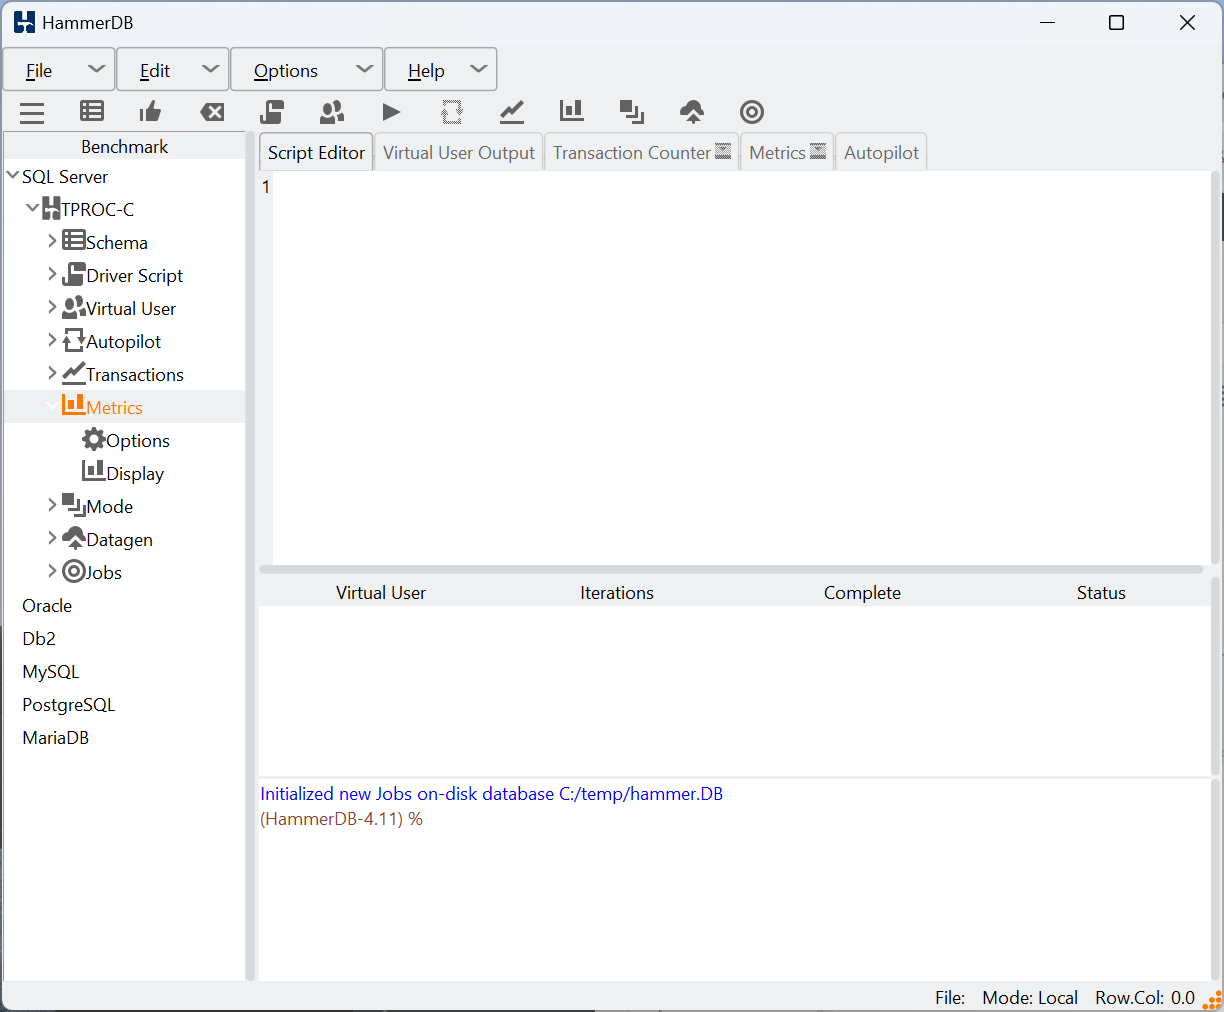
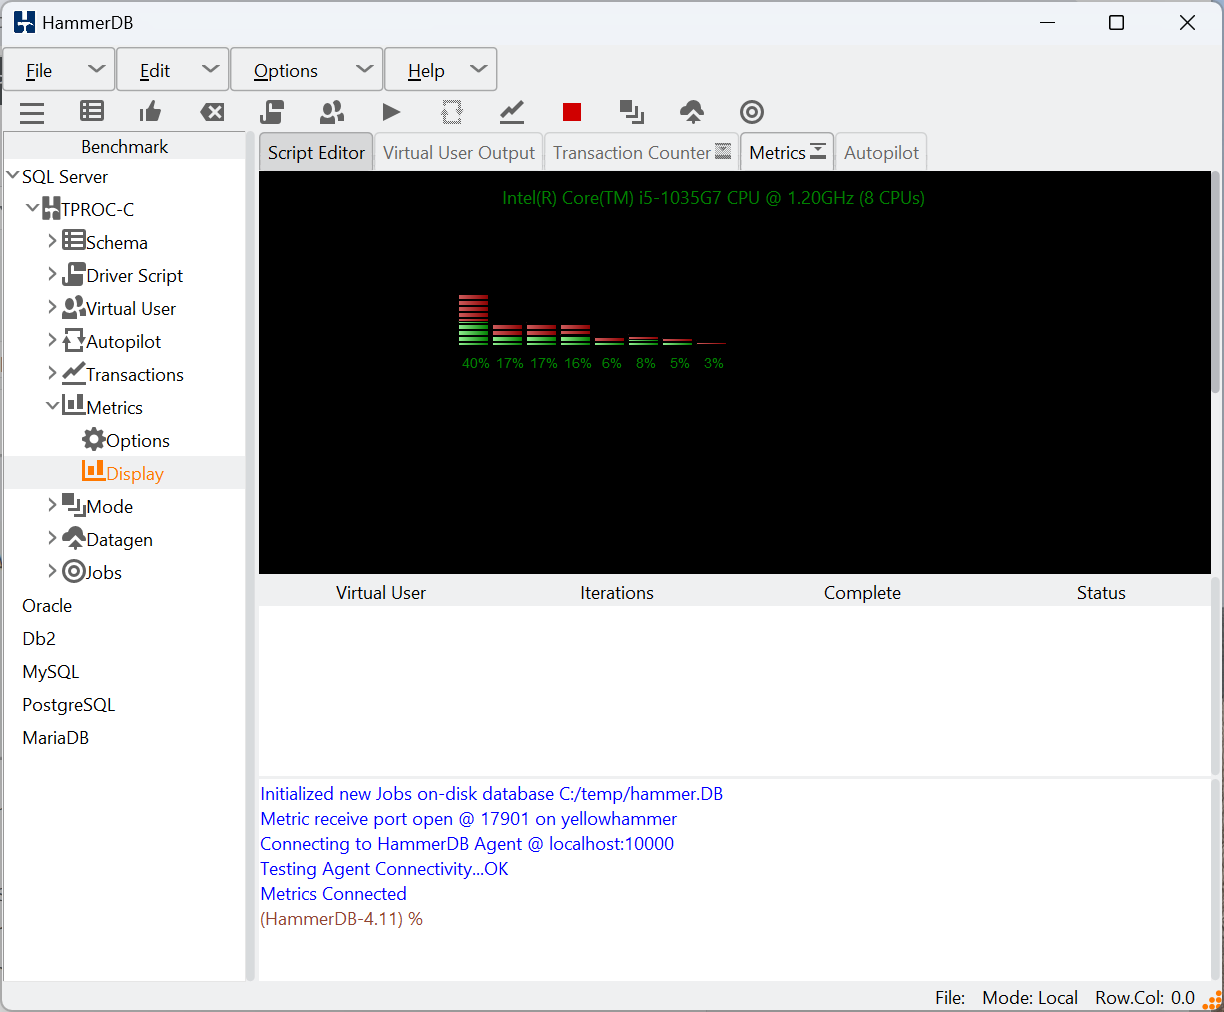
GUI Metrics interface
Under the GUI tree view you can see Metrics Options and Display. Options provides the Display with the configuration of the agent to connect to and Display starts the GUI connecting to the Display.
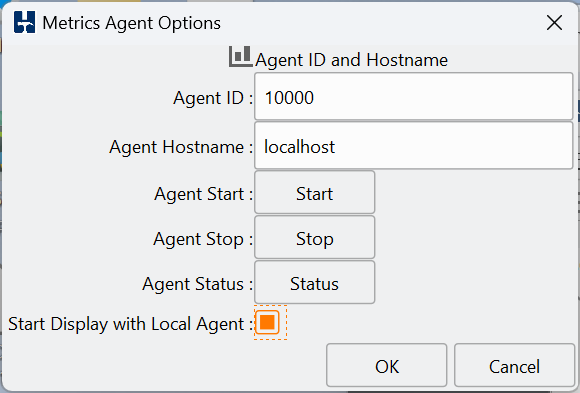
Under the metrics agent options enter the Agent ID that was either randomly chosen or specified when the agent was started and the hostname it is running on, either local or remote.
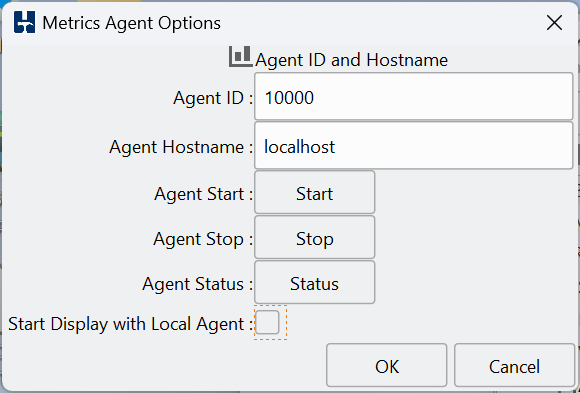
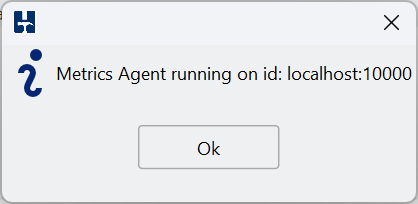
If the hostname is the localhost, then you can verify if the agent is running with the Agent Status button. As we already started the agent manually on port 10000 then we can see that HammerDB reports that the agent is already running.
Note that you can also see that we have the options to start and stop the agent from the GUI when we are running both the agent and the GUI on the same host. This starts and stops the agent in exactly the same way as described when running manually with providing the port number that you have specified under Agent ID.
With the agent running either locally or remotely, click Display in the tree view, the HammerDB Display will now connect to the tree view and begin showing the CPU metrics.
Note that the agent will also report that a Display has connected.
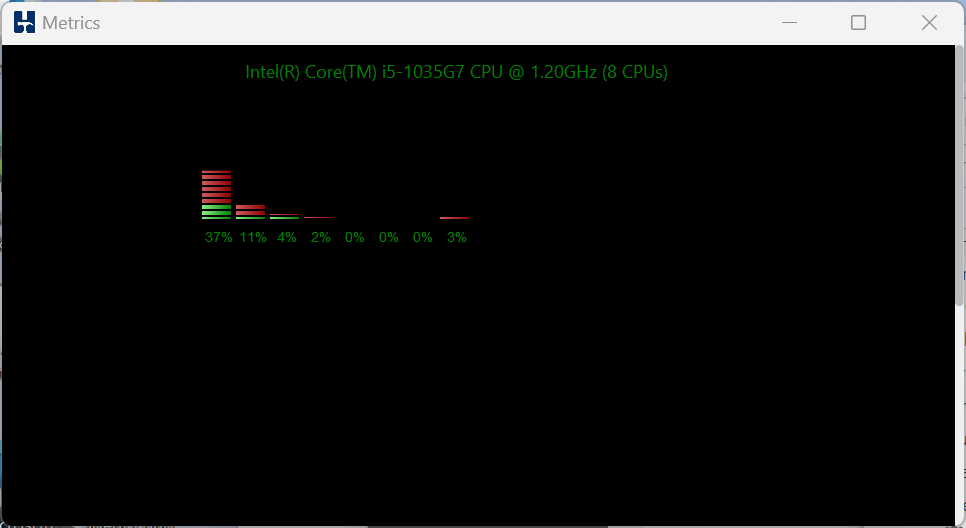
Also the metrics window can be dragged out of HammerDB to display standalone, or if closed will return to the HammerDB notebook.
Finally, if you select the Start Display with Local Agent checkbox, if this is selected and you click Agent Start, then both the Agent and Display will start running on the localhost in a single step.
CLI Metrics interface
The CLI metrics interface follows the same steps as the GUI. Firstly use the print generic command to observer the metrics settings.
hammerdb>print generic
Generic Dictionary Settings
...
metrics              {
 agent_hostname = localhost
 agent_id       = 10000
}
...
The metset command can be used to change the agent_hostname or agent_id.
hammerdb>metset
Usage: metset [agent_hostname|agent_id] value
The metstart command is used to start the CLI metrics display. If the agent host is the localhost and the agent is not already running then metstart will also start the agent.
hammerdb>metstart
Starting Local Metrics Agent on ubuntu
after#1
hammerdb>Connecting to Agent to Display CPU Metrics
Metric receive port open @ 37065 on ubuntu
Connecting to HammerDB Agent @ localhost:10000
Testing Agent Connectivity...OK
Metrics Connected
Started CPU Metrics for Intel(R) Xeon(R) Platinum 8280L CPU @ 2.70GHz:(112 CPUs)
CPU all usr%-0.06 sys%-0.04 irq%-0.00 idle%-99.87
CPU all usr%-0.08 sys%-0.04 irq%-0.00 idle%-99.85
CPU all usr%-0.06 sys%-0.03 irq%-0.00 idle%-99.90
CPU all usr%-0.04 sys%-0.03 irq%-0.00 idle%-99.91
...
metstatus checks whether the agent is running. Note that because the agent is a remote process then there may be some delay between starting the metrics and the status returning as running.
hammerdb>metstatus
CPU Metrics are running on ubuntu
Metrics Agent running on localhost:10000
Finally metstop stops the display and agent.
hammerdb>metstop
Stopping Metrics Agent and Display on localhost:10000
Typically these commands will be included in a script as follows:
set tmpdir $::env(TMP)
puts "SETTING CONFIGURATION"
jobs profileid 0
dbset db maria
dbset bm TPC-C
giset timeprofile xt_gather_timeout 1200
giset commandline keepalive_margin 1200

diset connection maria_host 127.0.0.1
diset connection maria_port 3306
diset connection maria_socket /tmp/mariadb.sock
#
diset tpcc maria_user root
diset tpcc maria_pass maria
diset tpcc maria_dbase tpcc
diset tpcc maria_driver timed
diset tpcc maria_rampup 2
diset tpcc maria_duration 5
diset tpcc maria_no_stored_procs false
diset tpcc maria_allwarehouse false
diset tpcc maria_timeprofile true
diset tpcc maria_purge true
#start CPU
metstart
puts "TEST STARTED"
loadscript
vuset vu 80
vuset logtotemp 1
vucreate
tcstart
tcstatus
vurun
tcstop
vudestroy
#stop CPU
metstop
puts "TEST COMPLETE"
and when the script is run you can observe that the CPU utilization is reported. Note that the difference from the GUI is that the CLI reports utilization for all CPUs whereas in the GUI you can observe the individual cores.
 ./hammerdbcli auto ./scripts/tcl/maria/tprocc/maria_tprocc_run_80vu.tcl
...
Vuser 1:Rampup 1 minutes complete ...
1616094 MariaDB tpm
CPU all usr%-56.20 sys%-7.32 irq%-0.00 idle%-36.39
1621218 MariaDB tpm
CPU all usr%-56.71 sys%-7.29 irq%-0.00 idle%-35.94
1605342 MariaDB tpm
CPU all usr%-56.55 sys%-7.18 irq%-0.00 idle%-36.19
1614732 MariaDB tpm
CPU all usr%-56.67 sys%-7.34 irq%-0.00 idle%-35.94
...
Vuser 28:FINISHED SUCCESS
Vuser 29:FINISHED SUCCESS
Vuser 1:Calculating timings...
Vuser 1:Writing timing data to /home/HammerDB-4.11/TMP/hdbxtprofile.log
CPU all usr%-4.81 sys%-0.33 irq%-0.00 idle%-89.32
111918 MariaDB tpm
CPU all usr%-2.82 sys%-0.17 irq%-0.00 idle%-96.98
0 MariaDB tpm
CPU all usr%-2.73 sys%-0.13 irq%-0.00 idle%-97.11
0 MariaDB tpm
CPU all usr%-2.84 sys%-0.11 irq%-0.00 idle%-97.03
0 MariaDB tpm
Vuser 1:Starting purge: history list length 3044852
CPU all usr%-2.67 sys%-0.08 irq%-0.00 idle%-97.23
0 MariaDB tpm
CPU all usr%-2.83 sys%-0.08 irq%-0.00 idle%-97.05
0 MariaDB tpm
CPU all usr%-2.61 sys%-0.09 irq%-0.00 idle%-97.21
0 MariaDB tpm
CPU all usr%-2.87 sys%-0.08 irq%-0.00 idle%-96.99
0 MariaDB tpm
CPU all usr%-3.00 sys%-0.07 irq%-0.00 idle%-96.88
0 MariaDB tpm
CPU all usr%-3.03 sys%-0.07 irq%-0.00 idle%-96.82
0 MariaDB tpm
CPU all usr%-2.94 sys%-0.11 irq%-0.00 idle%-96.85
0 MariaDB tpm
Vuser 1:Purge complete in 0 hrs:01 mins:11 secs
Vuser 1:Starting write back: dirty buffer pages 1161320
CPU all usr%-0.77 sys%-0.25 irq%-0.00 idle%-98.27
0 MariaDB tpm
Vuser 1:Write back complete in 0 hrs:00 mins:14 secs
Vuser 1:FINISHED SUCCESS
ALL VIRTUAL USERS COMPLETE
Transaction Counter thread running with threadid:tid0x7f83cd7fa700
Stopping Transaction Counter
vudestroy success
Stopping Metrics Agent and Display on localhost:10000
TEST COMPLETE
When the job has finished the new job system command will record the name of the CPU and the number of cores.
hammerdb>job 667D3F1561BD03E203533353 system
[
  "Intel(R) Xeon(R) Platinum 8280L CPU @ 2.70GHz",
  "112"
]
and the job metrics command will show the CPU utilization data for a particular job.
hammerdb>job 667D3F1561BD03E203533353 metrics
{
  "2024-06-27 03:29:51": {
    "usr%": "6.21",
    "sys%": "0.46",
    "irq%": "0.0",
    "idle%": "90.63"
  },
  "2024-06-27 03:30:01": {
    "usr%": "24.55",
    "sys%": "1.45",
    "irq%": "0.0",
    "idle%": "72.86"
  },
  "2024-06-27 03:30:11": {
    "usr%": "39.02",
    "sys%": "2.81",
    "irq%": "0.0",
    "idle%": "57.01"
  },
  "2024-06-27 03:30:21": {
    "usr%": "50.87",
    "sys%": "5.16",
    "irq%": "0.0",
    "idle%": "42.97"
  },
...
}
Viewing Metrics with the Web Service
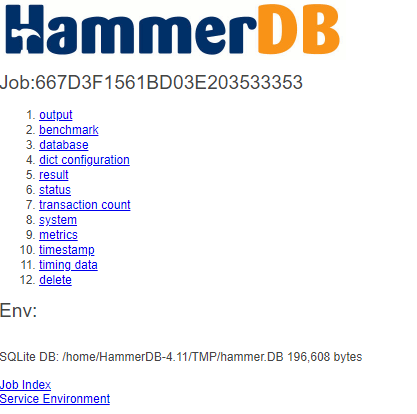
When you run a job with the CPU metrics running, either in the GUI or in the CLI the job will record the CPU that the workload is running on and the metrics data. Note that if the metrics is not running then the metrics and system links will be missing for a particular job.
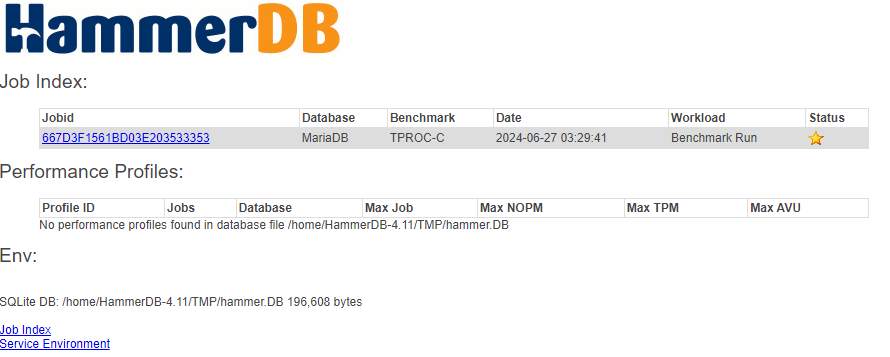
In the example we can see that the metrics was running for this job and the system and metrics links are present.
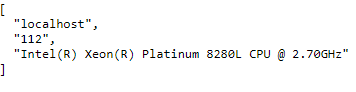
The system link reports the CPU that the job was run against.
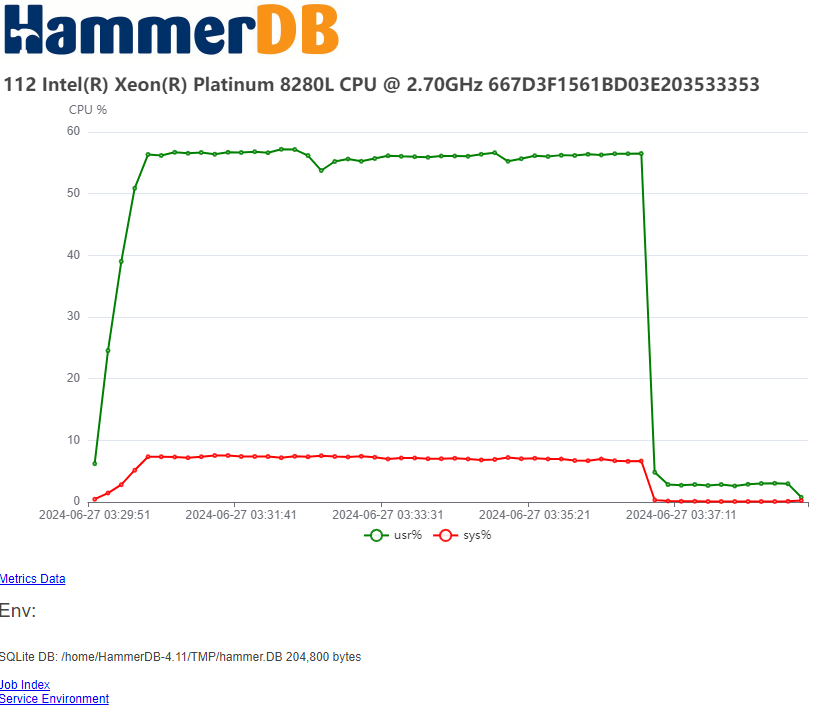
and the metrics link shows a graph for user% and sys% across the time the job was run.
Summary
HammerDB v4.11 adds functionality to improve capturing CPU utilisation during a job and storing this data for displaying along with other job related data. It also adds the metset, metstart, metstop and metstatus commands to run and capture CPU utilisation from the CLI interface.