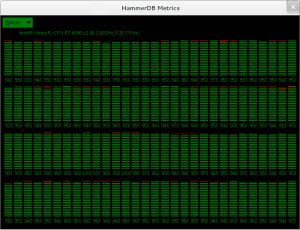
How to improve Redo, Transaction Log and WAL throughput for HammerDB benchmarks

If you are new to running Oracle, SQL Server, MySQL and PostgreSQL TPC-C workloads with HammerDB and have needed to investigate I/O performance the chances are that you have experienced waits on writing to the Redo, Transaction Log or WAL depending on the database you are testing. This post at an entry-level discusses the options you have to improve log throughput in your benchmark environment. 

Note that the parameters in this article do have the potential to cause data loss if implemented on your production database without full understanding so ensure that you have read this post in its entirety before applying the settings to your environment. 

Logging Waits

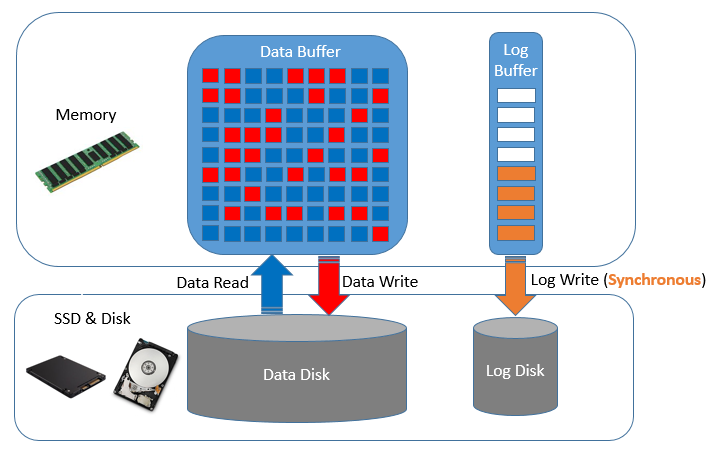
Firstly we’ll take a look at why these log waits are so important to database performance in an OLTP environment. The diagram below shows a much simplified way how the I/O in a typical relational database operates.

Before  the database is started your data should  be in a consistent state on disk. When the database is started a component of the in-memory database instance is the data buffer. As data is requested (depending on the type of read), data blocks will be fetched and stored in-memory in this buffer, show in-blue.  Over time your workload will modify this data, shown in-red, however these changed data blocks or pages are not written back to the data disk immediately. In fact a single block or page may be modified in-memory multiple times before it is eventually at some point in-time written back to the data disk. In contrast to many people’s understanding of a traditional database against an “in-memory” database it is likely that if the buffer is large enough most of the data you are operating on remains in-memory for the duration of a HammerDB OLTP test. Therefore you are likely to see a spike of reads at the start of the test (this is why there is ramp-up time) and then potentially depending on your configuration the data disk can be relatively quiet for the duration of the test while periodically seeing write activities related to checkpoints (which will be discussed later). 

However it should be clear that in the case of a failure such as a crash of the database all of the data in-memory would be lost.  Therefore you have the redo, transaction or write-ahead log recording all of the changes to the database. Typically we will see a constant stream of write activity to this disk with no (or minimal) read activity.  If there is a failure of the database, subsequently on startup this log will be used to recover the data on the data disk up to the point of the most recent transaction (or the chosen recovery point) i.e. replaying all of those changes in-memory that we lost. To recover right up to the most recent point those writes to the log needed to be synchronous i.e. when a transaction is committed the session waits until the database has confirmed that the changes have been recorded to the log before continuing work.  Note that this does not mean that the log is only written at the time of a commit, changes will be streamed into an in-memory log buffer and written to the log disk constantly however once a transaction is committed the user sessions will wait until this log write is confirmed. This wait by the session is what is typically seen as a log wait.  Bear in mind that writing to the log takes CPU, it will be a log writing thread or process that needs CPU time to be scheduled to be active,  it also requires memory for the log buffer and finally disk for the log itself, therefore this log wait is more than just the disk component. Additionally for the log disk component it is latency for an individual write that is crucial rather than the total I/O bandwidth.

As HammerDB supports graphical metrics for Oracle, this provides the best illustration however the concepts apply in general terms to all databases.

Oracle Log File Sync

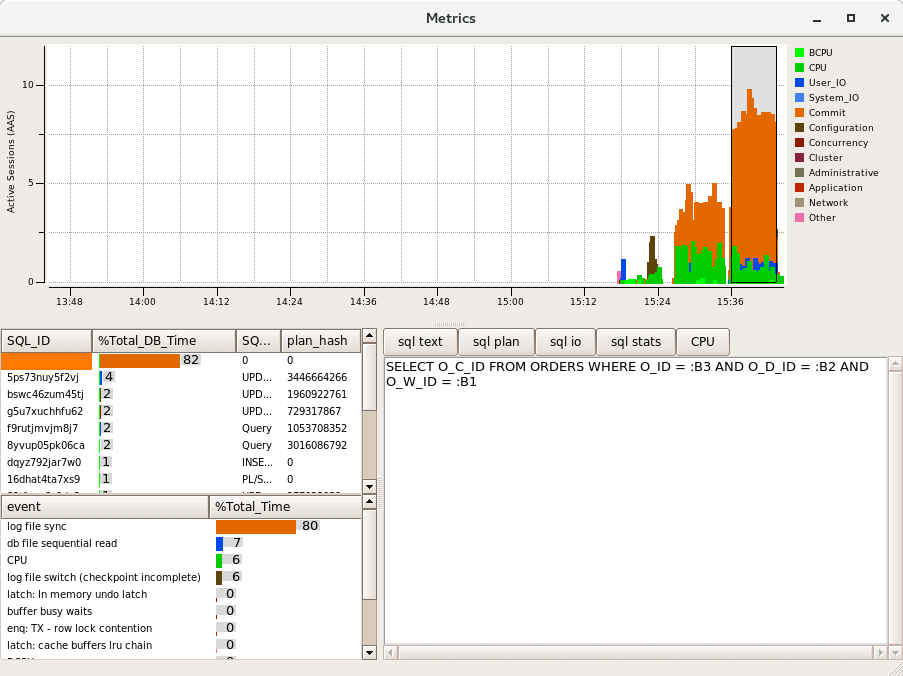
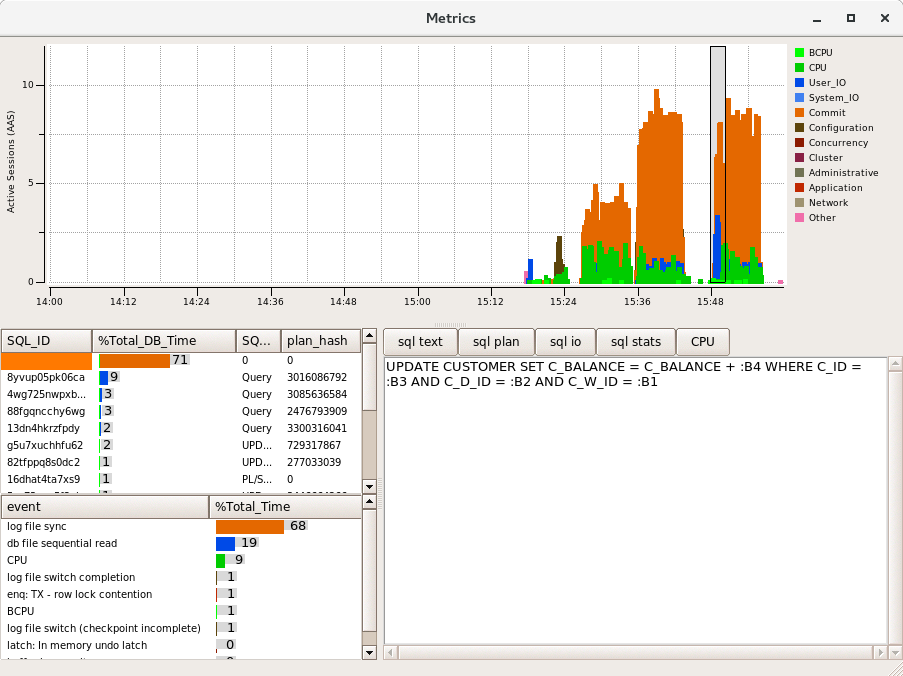
The following example takes a snapshot of Oracle metrics showing 3 spikes of activity on a consumer level PC running Oracle within a Virtual Box VM for illustration purposes.The database has been created with the default redo log configuration which is 2 redo logs of 200MB in size each.  The first example shows a data load, the second a TPC-C based workload with 5 virtual users and the 2nd example with 10 virtual users.

What can be seen fairly quickly is that the dominant colour is orange and the majority of database time is spent on “log file sync”, waiting for these synchronous writes to the redo log. As the activity is increased with the 2nd run performance is not improved, instead the database is spending more time waiting for the redo log.

To illustrate the data reads on Oracle we can flush the buffer cache.

SQL> alter system flush buffer_cache;

System altered.

SQL>

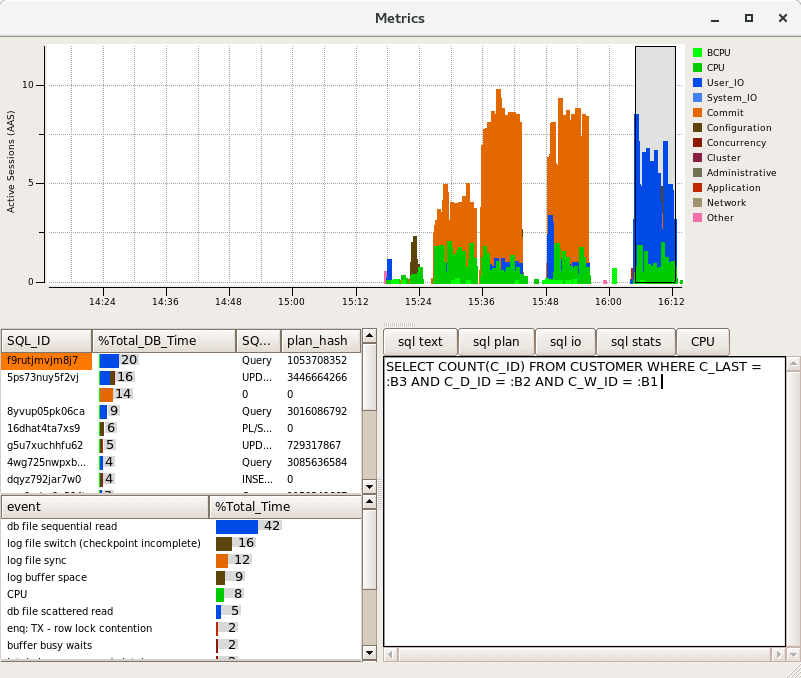
Re-running the same workload we can now see some blue read activity of “db file sequential read” from index reads at the start of the test, Once our data is buffered this read activity is then diminished as the data in memory is sufficient to sustain the workload that is being run by the rate that it is constrained by “log file sync”.

In this scenario the total throughput is considerably lower than the full potential of the system., so what are  your options?

Making Logging asynchronous

Clearly the most obvious option is to upgrade your log disk I/O capabilities to be able to sustain writes at the level that the test can produce and if running on a production system, this (and investigating your log size and configuration such as using the right disk sector size is the way to go). However what if in a test environment you cannot upgrade the log I/O but want to move beyond the log bottleneck to be able to test other system components more fully.  Fortunately all of the database supported by HammerDB include an option to make the logging asynchronous. In other words we will put our changes in the log buffer, issue a commit but not wait until this is confirmed. Instead we will continue under the assumption that the log write eventually made it to disk.  in this scenario it is possible that in the event of a failure data can be lost but for testing purposes it means we can potentially drive much higher levels of throughput than our log disk can typically sustain, showing the system potential if there were a better performing log configuration. Note however that this is not a solution that will make all log related waits disappear. As noted logging also involves CPU and memory and you will still need to make sure all writes reach the disk, the difference is that you are not flushing to disk synchronously on each commit and therefore are aiming to improve throughput by removing this dependency.

Oracle commit_wait and commit_logging

for Oracle the key parameter is commit_wait. By setting this parameter to NOWAIT the session will not wait for the write to be complete, instead continuing its work once the write has been issued.  This can be complemented by the parameter commit_logging being set to BATCH which groups the individual writes to be written in larger writes. 

commit_logging BATCH
commit_wait NOWAIT

These parameters can be set as follows:

SQL> alter system set commit_logging='BATCH' scope=spfile;

System altered.

SQL> alter system set commit_wait='NOWAIT' scope=spfile;

System altered.

Having set these parameters and re-run the previous test it can be seen that the wait events are now very different. In particular log file sync as intended has reduced considerably and been replaced by “db file sequential read” as the top event. Why is this the case? Because we have removed the log sync bottleneck we have now increased the throughput and put emphasis on the amount of data in the buffer that is being read-in and written-out at a much greater rate. Consequently we now need to increase the buffer cache in size if we are to see more CPU activity.  A good example of how tuning is an iterative process.

Checkpoint not complete

in the previous diagram we can also see the wait event log file switch (checkpoint incomplete). Returning to the first illustration it was shown that data will be periodically written to disk, at a checkpoint all of the data on disk is up to date with the same point in the log.  In this example with the default log configuration of 2 redo logs the database is attempting to switch from one log to the other however the checkpoint operation flushing the data from memory to the data disk has not yet caught up with the previous log and to begin writing to it would overwrite changes on the redo log that correspond to this not yet written yet, consequently the database will wait until this operation has been completed.

2018-11-02T15:38:27.662098+00:00
Thread 1 advanced to log sequence 1402 (LGWR switch)
  Current log# 1 seq# 1402 mem# 0: /home/oracle/app/oracle/oradata/VULCDB1/onlinelog/o1_mf_1_fjj87ghr_.log
2018-11-02T15:39:25.628040+00:00
Thread 1 cannot allocate new log, sequence 1403
Checkpoint not complete
  Current log# 1 seq# 1402 mem# 0: /home/oracle/app/oracle/oradata/VULCDB1/onlinelog/o1_mf_1_fjj87ghr_.log
2018-11-02T15:39:29.360911+00:00
Thread 1 advanced to log sequence 1403 (LGWR switch)
  Current log# 2 seq# 1403 mem# 0: /home/oracle/app/oracle/oradata/VULCDB1/onlinelog/o1_mf_2_fjj87gjj_.log

As can be seen this has happened on a consumer PC configuration with the default redo configuration, therefore for higher throughput also ensure that you resize the logs accordingly.

SQL Server DELAYED_DURABILITY

For SQL Server the equivalent parameter for asynchronous logging is set as follows for the parameter DELAYED_DURABILITY

ALTER DATABASESET DELAYED_DURABILITY = { DISABLED | ALLOWED | FORCED } 

On the same test system it can be seen that without setting this parameter, Logging is shown as the top resource wait. 

After setting ALTER DATABASE TPCC SET DELAYED_DURABILITY = FORCED  it can be seen that the waits on logging are reduced.

MySQL

For MySQL the dependency is at the storage engine level and in this case for the InnoDB storage engine the parameter is self-explanatory.

innodb_flush_log_at_trx_commit=0
PostgreSQL

Similarly for PostgreSQL logging can be set by setting synchronous_commit to off.

synchronous_commit = off                # synchronization
Summary

This post aims to address what is the most common scenario for someone running HammerDB TPC-C OLTP workloads for the first time when seeing waits on logging disks and what parameters can be set in a test based environment to achieve more throughput and observe what performance potentially could be achieved without a log disk bottleneck. 

Driving hammerdbcli from a bash script

Update: There is considerably more efficient method of running HammerDB through a bash script described in a more recent post here:  Running hammerdbcli from a bash or batch script updated for v3.2 It is strongly recommended to move to this method described for v3.2 rather than the method described in this post which can have a greater overhead and a potential impact on performance imposed by bash.

A current FAQ is how to drive the command line hammerdbcli from an external bash script. This post gives an example of one way which this can be done.

For an example we will run a bash script that prints output and then runs hammerdbcli to build an Oracle schema before wating for this to finish and printing more output.  Firstly we need the hammerdbcli script.  Note that as HammerDB is multithreaded, adding exit to the end of a script will cause that script to terminate before virtual users are complete. This is unlikely to be the desired outcome. Therefore you need a function that will wait for the script to complete before issuing the exit. The important command here is vucomplete and you need to wait until the condition of this is “true”. An example of this is as follows:

#!/bin/tclsh
puts "SETTING CONFIGURATION"
global complete
proc wait_to_complete {} {
global complete
set complete [vucomplete]
if {!$complete} {after 5000 wait_to_complete} else { exit }
}
dbset db ora
diset connection system_password oracle
diset connection instance vulpdb1 
diset tpcc count_ware 4
diset tpcc num_vu 4
diset tpcc tpcc_def_tab users
print dict
buildschema
wait_to_complete

This script has been saved as buildora.tcl.  Now we want the driving bash script that looks as follows:

#!/bin/bash
echo "BASH SCRIPT BEFORE BUILD.."
./hammerdbcli <<!
source buildora.tcl
!
echo "BASH SCRIPT AFTER BUILD.."

if you want to redirect your output to a file it can look like the following:

#!/bin/bash
echo "BASH SCRIPT BEFORE BUILD.."
./hammerdbcli <<!>> buildora.output 2>&1
source buildora.tcl
!
echo "BASH SCRIPT AFTER BUILD.."

If you run the bash script it will now call hammerdbcli that will run buildora.tcl, this will wait until complete to call exit before returning control back to the bash script. This is just one example of many ways in which hammerdbcli can be blended with Tcl, bash or even Python to automate HammerDB functionality.

If it is needed to strip the control characters from the output this can be done using sed. The stdbuf command can also be used to write the output line by line to the output file.

#!/bin/bash
echo "BASH SCRIPT BEFORE BUILD.."
./hammerdbcli <<! 2>&1 | stdbuf -oL -eL sed -e "s,\x1B\[[0-9;]*[a-zA-Z],,g" -e "s,\r,,g" -e "s,hammerdb>,,g" -e "s,after\#[0-9]*,,g" >> buildora.output
source buildora.tcl
!
echo "BASH SCRIPT AFTER BUILD.."

Real Time Oracle Performance Monitoring for Benchmarks

An essential part of database performance testing is viewing the statistics generated by the database during the test and in 2009 HammerDB introduced automatic AWR snapshot generation for Oracle for the TPC-C test. With this feature Oracle generates a wealth of performance data that can be reviewed once the test is complete. However what if you want to review performance data in real time as the test is running? With HammerDB 3.1 you can now do that with Oracle Metrics. 
Before introducing how this works it is important to acknowledge the ASHMON tool from which this functionality was adopted and more importantly its author Kyle Hailey for giving permission to add it as open source.

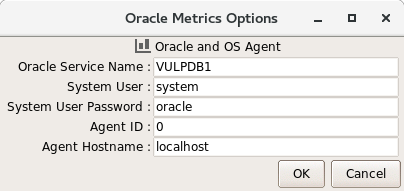
To get started with Oracle metrics use the previous option for CPU metrics that now shows the service name and system user and password.

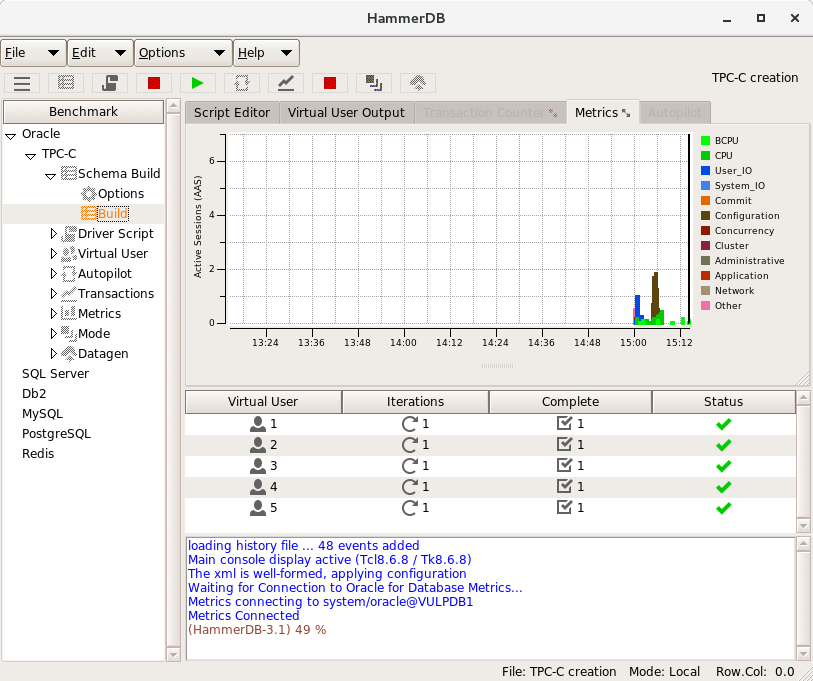
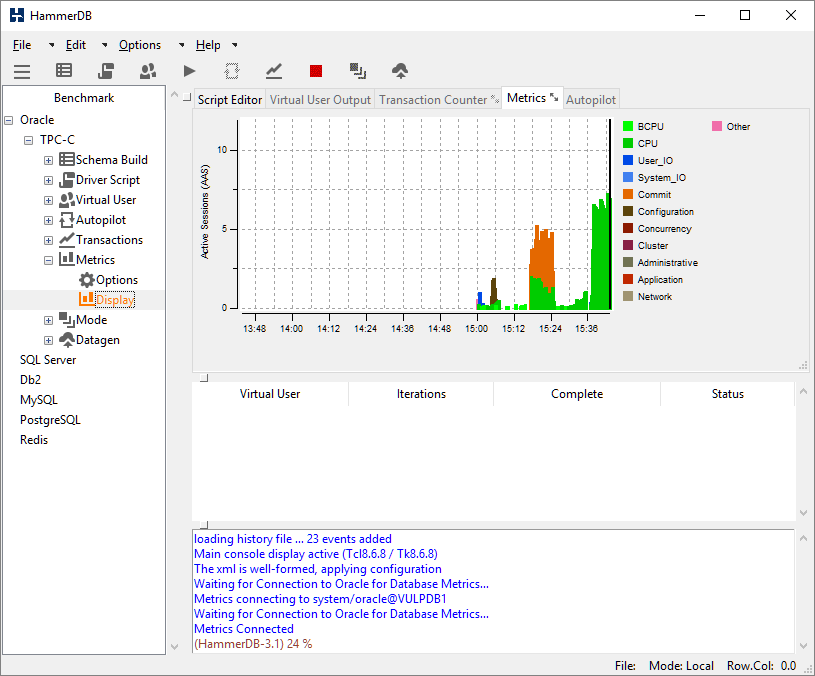
With these filled out click the metrics button and once connected to the Oracle database the metrics window will appear embedded within HammerDB. 

you can either resize the window embedded using the grab bar or you can grab the tab at the top of the notebook that says Metrics (with the arrows indicator) and drag the window out to be standalone (closing the window embeds it again).

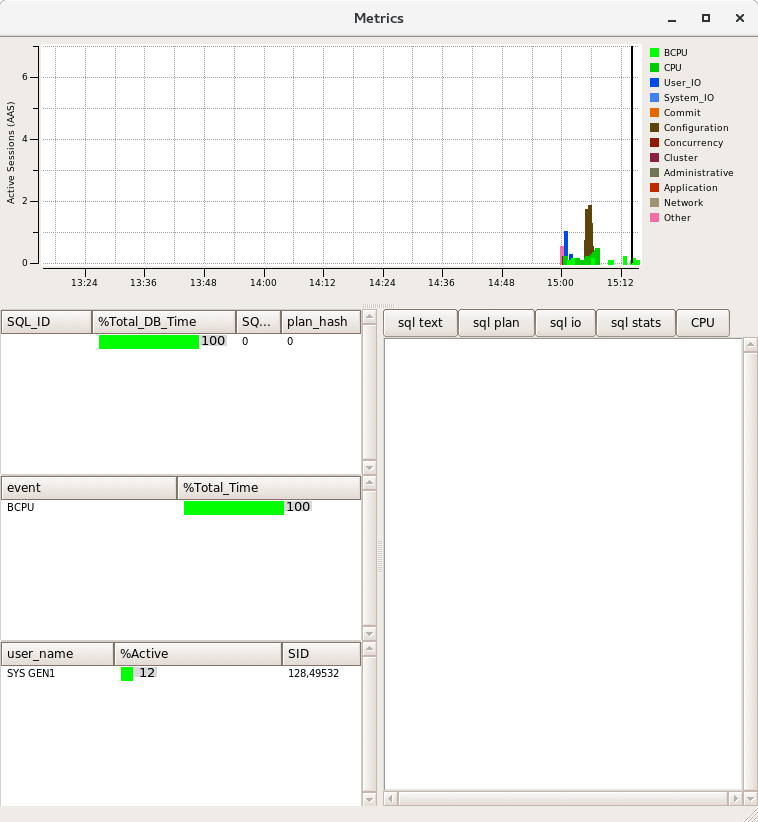
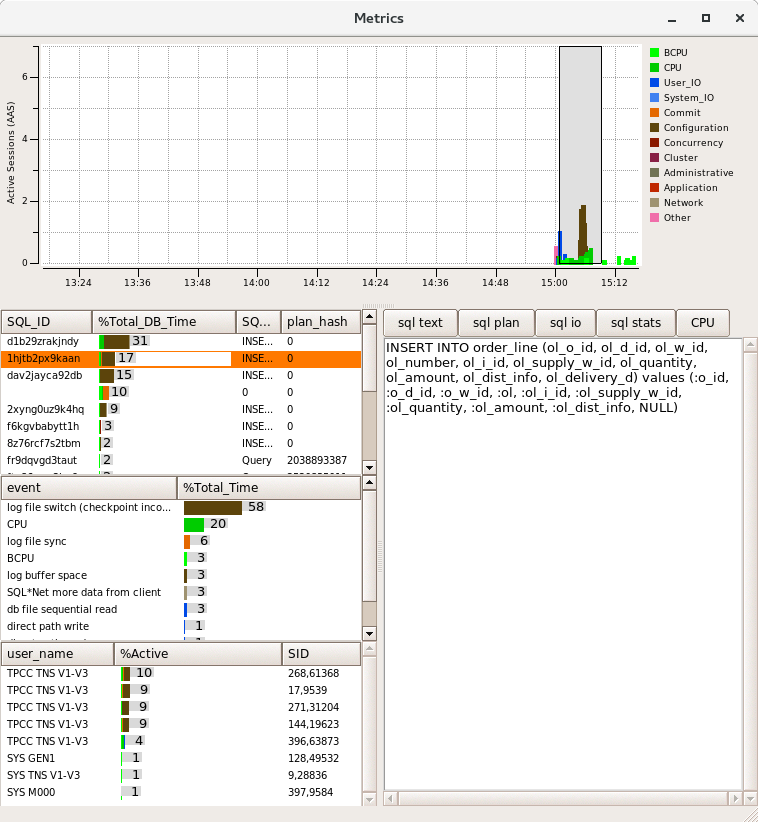
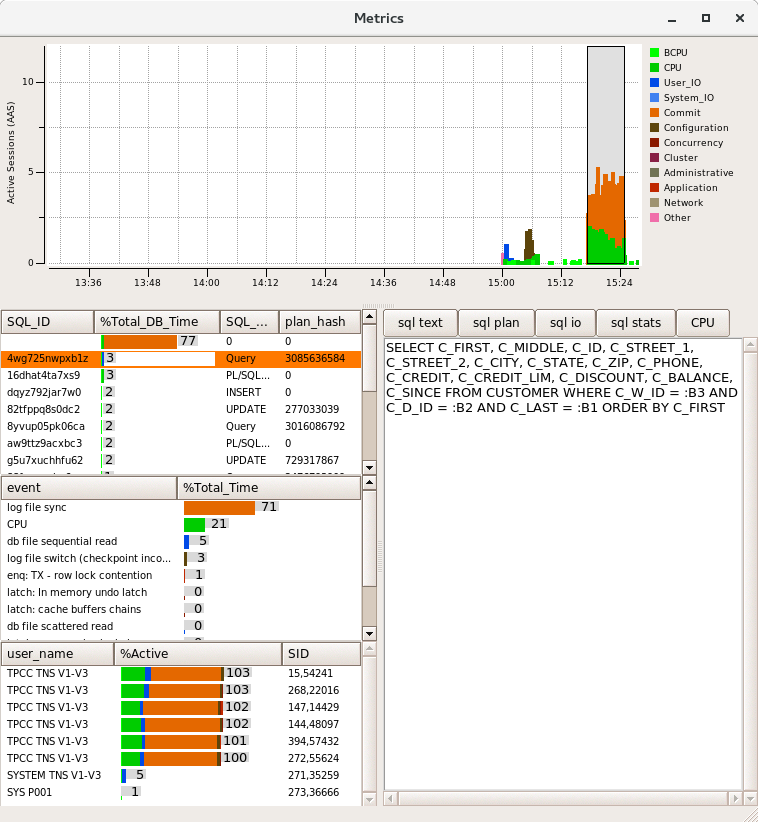
As this feature uses the Oracle Active Session History, use the mouse to highlight a timeframe of interest and the SQL, wait events and users will appear in the panes to the left. On the right you have the choice of displaying the sql text, explain plan, io or statistics. The CPU option allows you to view the original live CPU metrics window. It is clear from the window below that HammerDB was running a schema build and the top wait event was log file switch (checkpoint incomplete) – time to resize the redo logs or move them to faster disk!

Running a TPC-C performance test information can be viewed live (by not selecting an area) or by highlighting the area of interest. In this example a test with 2 minute rampup and 5 minute test time can be seen.  It is also clear that most significant wait event is “log file sync” and therefore tuning should focus on the redo log performance. The user CPU is highlighted in green and the aim for maximum performance is for the top event to be CPU. 

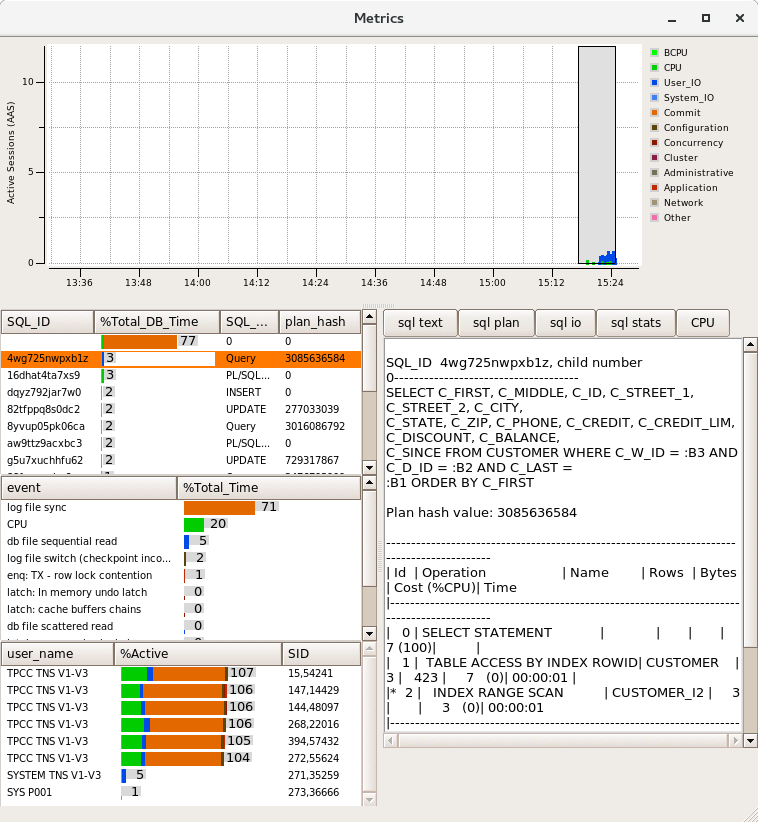
You can also drill down on particular SQL ID’s be double clicking on them that will highlight the related wait events and in this example the session showing the most “db file sequential read” is highlighted with the associated explain plan showing the index access that we would expect. 

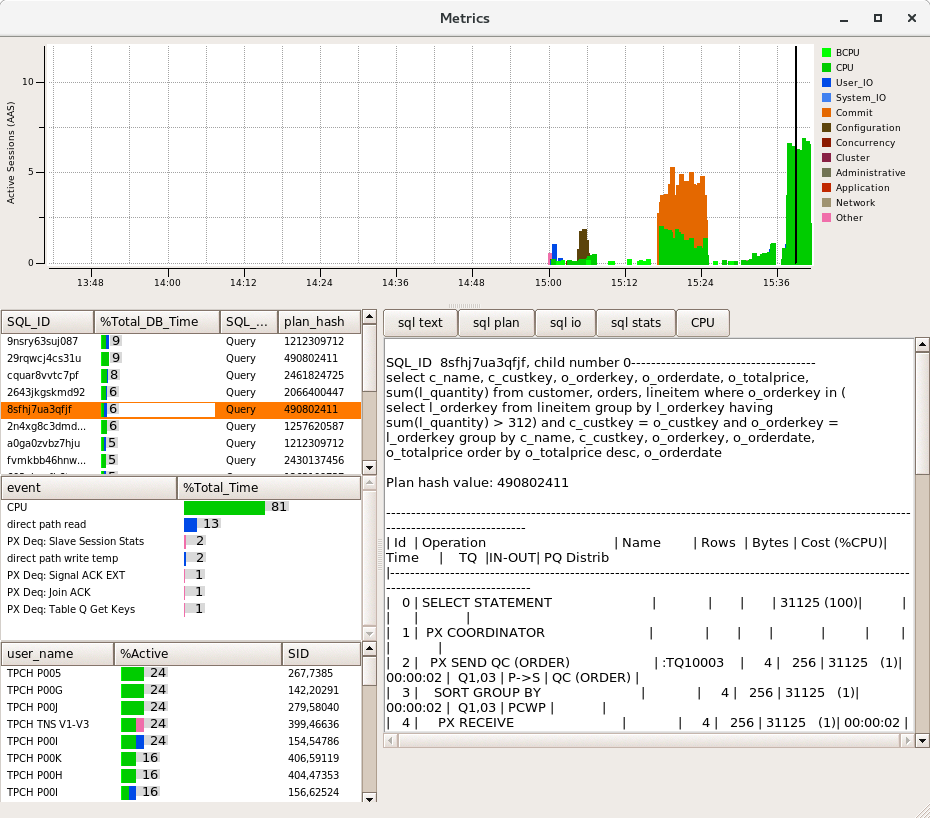
All of this functionality is also available for the TPC-H workload as well so you can see the actual queries how they were run, the explain plans and the events. 

Finally like all HammerDB features everything that is available on Linux is equally available on Windows as well so if running an Oracle client on Windows you can access exactly the same features to monitor your benchmark performance in real time. 


How Many Warehouses for the HammerDB TPC-C Test?

This is a very typical FAQ and although detailed in the documentation some extra details may help in sizing and configuration. For a really quick answer create a schema with 250-500 warehouses per server CPU socket for more details size as follows. 

The official TPC-C test has a fixed number of users per warehouse and uses keying and thinking time so that the workload generated by each user is not intensive. However most people use HammerDB with keying and thinking time disabled and therefore each virtual user can approximately drive the CPU resources of one CPU core on the database server. Therefore the relationship between virtual users, warehouses and cores can be seen, you need considerably fewer virtual users and warehouses to drive a system to maximum throughput than the official test. 
 
Additionally it is important to understand the workload. With HammerDB this home warehouse is chosen at random at the start of the test and remains fixed. For example it can then be understood that if you configure a schema with 1000 warehouses and run a test with 10 virtual users by default most of the workload will be concentrated upon 10 warehouses. (It is important to note the “by default” clause here as there is an exception to change this behaviour if desired). Also with the home warehouse chosen at random it should be clear that number of warehouses should be configured so that when the maximum number of virtual users that you will run are configured there is a good chance that the selection of a home warehouse at random will be evenly distributed across the available warehouses with one or possibly 2 virtual users selecting the same home warehouse at random but not more.  
 
As an example configuring a 10 warehouse schema and running 100 virtual users against this schema would be an error in configuration as it would be expected for 10 virtual users or more to select the same warehouse. Doing this would mean that the workload would spend considerably more time in lock contention and would not produce valid results. Typically an option of 4 to 5 warehouses per virtual user would be a minimum value to ensure an even distribution of virtual users to warehouse. Therefore for the 100 virtual users 400 to 500 warehouses should be a minimum to be configured.  As noted configuring more should not have a major impact on results as depending on the number of virtual users used in the test most the warehouses will be idle (and ideally most of the warehouses you are using will be cached in memory in your buffer cache so the I/O to the data area is minimal). 
 
As one virtual user can drive most of the capacity of one CPU core the actual value for the number of warehouses you choose will depend upon the number of cores per socket. Note that if using CPUs with Hyper-Threading allow for additional CPU capacity, so size as if there were 35% more physical cores.  Also depending on your chosen database some database software will not scale to fully utilise all cores, see the best practice guides for guidance on your chosen database. If CPU utilisation is limited then you will need fewer warehouses configured and virtual users for the test.  
 
It should also be clear that there is no completely accurate one-size-fits-all type guidance for warehouse sizing as different databases will scale differently and some may need more warehouses and virtual users than others to reach peak performance.  A common error is to size many thousands of warehouses and virtual users with the aim of reaching high performance but instead resulting in high levels of contention and low performance.  Even for highly scalable databases on large systems upper limits for tests without keying and thinking time are in the region of 2000 warehouses for up to 500 virtual users for maximum performance. 
 
There is one exception to the guidance above and that is when the “Use all Warehouses” checkbox is selected as shown. 
When this option is chosen instead of each virtual user choosing a home warehouse at random instead all of the available warehouses are divided between the virtual users and they then select a new home warehouse for each transaction. This option has been provided to increase the I/O to the data area and therefore when using this option you can choose to configure more warehouses with the knowledge that you will use them in contrast to the default option which will cache most of the warehouses used with the aim of reaching maximum performance and CPU utilisation. 

HammerDB MySQL and MariaDB Best Practice for Performance and Scalability

This post complements the previous best practice guides this time with the focus on MySQL and MariaDB and achieving top levels of performance with the HammerDB MySQL TPC-C test.  As with the previous guides as an Intel employee (#IAMINTEL) the examples are taken from a MySQL 8 on Linux on Intel system and the approach is the same for whatever system you are testing although some of the settings you see may be different. Similarly for this guide MySQL can be swapped for a mySQL based databases such as MariaDB.

As is exactly the same with PostgreSQL for system choice a 2 socket system is optimal for MySQL OLTP performance. As is also the case this limitation is at the database level (especially the storage engine) rather than the hardware level. InnoDB is the storage engine that will deliver the best OLTP throughput and should be chosen for this test. 
 

HammerDB difference from Sysbench

For anyone benchmarking MySQL with HammerDB it is important to understand the differences from sysbench workloads as HammerDB is targeted at a testing a different usage model from sysbench. Historically MySQL has been positioned for supporting web-based applications this is in contrast to enterprise based database workloads that have been served by commercial databases such as Oracle, Db2 and SQL Server. For this reason sysbench presents a vastly more simplified workload than HammerDB.  

By default sysbench creates a single table with an ascending primary key and an identical pad column. 
MariaDB [sbtest]> select * from sbtest limit 10
    -> ;
+----+---+---+----------------------------------------------------+
| id | k | c | pad                                                |
+----+---+---+----------------------------------------------------+
|  1 | 0 |   | qqqqqqqqqqwwwwwwwwwweeeeeeeeeerrrrrrrrrrtttttttttt |
|  2 | 0 |   | qqqqqqqqqqwwwwwwwwwweeeeeeeeeerrrrrrrrrrtttttttttt |
|  3 | 0 |   | qqqqqqqqqqwwwwwwwwwweeeeeeeeeerrrrrrrrrrtttttttttt |
|  4 | 0 |   | qqqqqqqqqqwwwwwwwwwweeeeeeeeeerrrrrrrrrrtttttttttt |
|  5 | 0 |   | qqqqqqqqqqwwwwwwwwwweeeeeeeeeerrrrrrrrrrtttttttttt |
|  6 | 0 |   | qqqqqqqqqqwwwwwwwwwweeeeeeeeeerrrrrrrrrrtttttttttt |
|  7 | 0 |   | qqqqqqqqqqwwwwwwwwwweeeeeeeeeerrrrrrrrrrtttttttttt |
|  8 | 0 |   | qqqqqqqqqqwwwwwwwwwweeeeeeeeeerrrrrrrrrrtttttttttt |
|  9 | 0 |   | qqqqqqqqqqwwwwwwwwwweeeeeeeeeerrrrrrrrrrtttttttttt |
| 10 | 0 |   | qqqqqqqqqqwwwwwwwwwweeeeeeeeeerrrrrrrrrrtttttttttt |
+----+---+---+----------------------------------------------------+
10 rows in set (0.02 sec)

The workload then interacts with the database with simple SQL statements, for example with the read-only workload statements such as follows:
SELECT SUM(K) from sbtest where id between ? and ?
SELECT DISTINCT c from sbtest where id between ? and ? order by c
SELECT c from sbtest where id=?
Consequently there is no contention and the workload will scale according to the ability of the database to handle these isolated statements. 

HammerDB on the other hand is based on the TPC-C specification (but not identical to a full TPC-C workload) and more closely represents an enterprise type workload. There are 9 tables:
MariaDB [tpcc]> show tables;
+----------------+
| Tables_in_tpcc |
+----------------+
| customer       |
| district       |
| history        |
| item           |
| new_order      |
| order_line     |
| orders         |
| stock          |
| warehouse      |
+----------------+
9 rows in set (0.00 sec)
The tables have more complexity than sbtest:
 
MariaDB [tpcc]> select * from customer limit 1 G
*************************** 1. row ***************************
          c_id: 1
        c_d_id: 1
        c_w_id: 1
       c_first: 4fTYMkzYdy8EbABc
      c_middle: OE
        c_last: BARBARBAR
    c_street_1: G30TzdyBM1xx
    c_street_2: fRveiqUZDzz54pt9FK8
        c_city: jVRLzrSBopMpcmN4WYO2
       c_state: JK
         c_zip: 603111111
       c_phone: 4610643910936129
       c_since: 2018-10-11 08:48:51
      c_credit: BC
  c_credit_lim: 50000.00
    c_discount: 0.2000
     c_balance: -10.00
c_ytd_payment: 10.00
c_payment_cnt: 1
c_delivery_cnt: 0
c_data: hjtWypvebZZgVhNCdKOhHd50Wn7HQG8XAm9cSHkXTf73KqBHot7IvHq8PtaHdaJ9oMXqFx6aUXrBRxQ44gqLf0k04gkPVWc6Lx3q71gFCu1vZlLhmmIaWQf5zyDD4AAqejVcwYKi50P9rHFegjzURpTf6c9SPEfpupc7378uekwBYTj4Xfm0Od3ukiQIKto8Nlx1Is51pC4qynxLEWWGULhXdBipYckk5EjpbpdKzUjEcMGJ6nCmFpNgXfKDIUpaYsw1dWwgCEhPfXiKjXMO0v0iF56wzD6AOF4w7m8CXSw0x5zKB7URuTqlGedSYK8EvmylYudXLF
1 row in set (0.00 sec)
and the workload is driven by stored procedures:
 
MariaDB [tpcc]> show procedure status
    -> ;
+-------+--------------------+-----------+----------------+---------------------+---------------------+---------------+---------+----------------------+----------------------+--------------------+
| Db    | Name               | Type      | Definer        | Modified            | Created             | Security_type | Comment | character_set_client | collation_connection | Database Collation |
+-------+--------------------+-----------+----------------+---------------------+---------------------+---------------+---------+----------------------+----------------------+--------------------+
| tpcc  | DELIVERY           | PROCEDURE | @              | 2018-10-11 08:57:34 | 2018-10-11 08:57:34 | DEFINER       |         | latin1               | latin1_swedish_ci    | latin1_swedish_ci  |
| tpcc  | NEWORD             | PROCEDURE | @              | 2018-10-11 08:57:34 | 2018-10-11 08:57:34 | DEFINER       |         | latin1               | latin1_swedish_ci    | latin1_swedish_ci  |
| tpcc  | OSTAT              | PROCEDURE | @              | 2018-10-11 08:57:34 | 2018-10-11 08:57:34 | DEFINER       |         | latin1               | latin1_swedish_ci    | latin1_swedish_ci  |
| tpcc  | PAYMENT            | PROCEDURE | @              | 2018-10-11 08:57:34 | 2018-10-11 08:57:34 | DEFINER       |         | latin1               | latin1_swedish_ci    | latin1_swedish_ci  |
| tpcc  | SLEV               | PROCEDURE | @              | 2018-10-11 08:57:34 | 2018-10-11 08:57:34 | DEFINER       |         | latin1               | latin1_swedish_ci    | latin1_swedish_ci  |
+-------+--------------------+-----------+----------------+---------------------+---------------------+---------------+---------+----------------------+----------------------+--------------------+
7 rows in set (0.00 sec)
an example is shown of the shortest of these: 
CREATE DEFINER=`` PROCEDURE `slev`(
st_w_id                 INTEGER,
st_d_id                 INTEGER,
threshold               INTEGER
)
BEGIN
DECLARE st_o_id         INTEGER;
DECLARE stock_count     INTEGER;
DECLARE `Constraint Violation` CONDITION FOR SQLSTATE '23000';
DECLARE EXIT HANDLER FOR `Constraint Violation` ROLLBACK;
DECLARE EXIT HANDLER FOR NOT FOUND ROLLBACK;
SELECT d_next_o_id INTO st_o_id
FROM district
WHERE d_w_id=st_w_id AND d_id=st_d_id;
SELECT COUNT(DISTINCT (s_i_id)) INTO stock_count
FROM order_line, stock
WHERE ol_w_id = st_w_id AND
ol_d_id = st_d_id AND (ol_o_id < st_o_id) AND
ol_o_id >= (st_o_id - 20) AND s_w_id = st_w_id AND
s_i_id = ol_i_id AND s_quantity < threshold;

As a result there is deliberate contention in the HammerDB workload that is not seen in a sysbench one. Also as HammerDB is making one call to stored procedure that then contains multiple SQL statements the workload throughput is significantly higher than sysbench. 

More recently MySQL and MariaDB has been positioned in the enterprise space competing with commercial database such as Oracle with features such as PL/SQL compatibility.  Therefore if you are testing MySQL or MariaDB’s ability to support web-based applications that use  SQL statements with minimal contention then sysbench is likely to present the best assessment of the system for this type of workload. On the other hand if testing MySQL or MariaDB for the ability to handle a more complex workload such as the use of stored procedures and in particular if looking to compare scalability with a traditional database then HammerDB is focused more towards testing those enterprise features. Finally it is also important to note that this comparison is focused around OLTP based workloads, HammerDB also supports a TPC-H based workload for analytics with complex ad-hoc queries. Traditionally MySQL has not supported such workloads however features such as columnstore in MariaDB now make this possible.  

System Setup: CPU, Memory and I/O Configuration

System setup is covered on the PostgreSQL Best Practice post so it will not be repeated here as the steps are the same. Make sure that the I/O that is able to keep up with writing to the redo log. Also make sure that if using an Intel CPU it is correctly configured with the right drivers and setup for turbo boost with cpupower output as follows: 
./cpupower frequency-info
analyzing CPU 0:   
driver: intel_pstate
  CPUs which run at the same hardware frequency: 0   
CPUs which need to have their frequency coordinated by software: 0   
maximum transition latency:  Cannot determine or is not supported.   
hardware limits: 1000 MHz - 3.80 GHz
available cpufreq governors: performance powersave   
current policy: frequency should be within 1000 MHz and 3.80 GHz.
                   The governor "performance" may decide which speed to use
                   within this range.
 current CPU frequency: Unable to call hardware   
 current CPU frequency: 1.99 GHz (asserted by call to kernel)   
boost state support:
     Supported: yes
     Active: yes

Finally in testing Huge Pages has less of an impact than with PostgreSQL, although performance should not be lower than having Huge Pages disabled. Just note that if using MariaDB in some versions a bug means that Huge Pages cannot be enabled although this does not greatly impact performance.

Install MySQL or MariaDB from Source

(Note that the following section applies in particular to pre-2019 versions of MySQL and MariaDB and more recent versions of MySQL 8 have already been updated for optimal performance on multiple platforms and therefore the change is this section is not required)

The MySQL manual advises that building from source allows you customize build parameters and as with PostgreSQL this can also be the best way to achieve maximum performance. In particular with a workload such as HammerDB there is a lot of emphasis on locking and latching that is not seen in a sysbench workload and therefore you may see gains in modifying the InnoDB storage engine code. In InnoDB some of this behaviour is hardcoded however the CPU PAUSE instruction that is used by the UT_RELAX_CPU macro can and does vary between CPUs.  In particular on Intel Scalable Processors (Skylake architecture) the PAUSE instruction is much longer than previous architectures and therefore calling UT_RELAX_CPU can consume a lot more time resulting in reduced performance.  It may be the case that by the time you are testing this you can modify this behaviour with a parameter. Otherwise find the file ut0ut.cc in the directory storage/innobase/ut and modify the value accordingly, by default it is set to 50, for Skylake 5 is more appropriate for the delay multiplier. 
for (i = 0; i <delay * 5; i++) {
    j += i;
    UT_RELAX_CPU();
  }

If unsure on whether to do this run the workload and use the perf command to observe the top functions. If “ut_delay” is consuming most of the CPU (in most cases it will still be one of the top functions) then potentially modifying this code can increase performance. 

Configure MySQL

An example MySQL my.cnf file is shown.  Note that innodb_file_per_table is set then when we use partition in HammerDB it can insert into multiple files one per partition.  This gives a performance gain. One configured start the MySQL or MariaDB database.  For more details on MySQL and optimization see the website by Dimitri Kravtchuk

[mysqld]
large-pages
skip-log-bin
datadir=/home/mysql/data
language=/homemysql/bld/share/english
default_authentication_plugin=mysql_native_password
socket=/tmp/mysql.sock
port=3306
bind_address=192.168.1.1
# general
max_connections=4000
table_open_cache=8000
table_open_cache_instances=16
back_log=1500
default_password_lifetime=0
ssl=0
performance_schema=OFF
max_prepared_stmt_count=128000
skip_log_bin=1
character_set_server=latin1
collation_server=latin1_swedish_ci
transaction_isolation=REPEATABLE-READ
# files
innodb_file_per_table
innodb_log_file_size=1024M
innodb_log_files_in_group=32
innodb_open_files=4000
# buffers
innodb_buffer_pool_size=64000M
innodb_buffer_pool_instances=16
innodb_log_buffer_size=64M
# tune
innodb_doublewrite=0
innodb_thread_concurrency=0
innodb_flush_log_at_trx_commit=0
innodb_max_dirty_pages_pct=90
innodb_max_dirty_pages_pct_lwm=10
join_buffer_size=32K
sort_buffer_size=32K
innodb_use_native_aio=1
innodb_stats_persistent=1
innodb_spin_wait_delay=6
innodb_max_purge_lag_delay=300000
innodb_max_purge_lag=0
innodb_flush_method=O_DIRECT_NO_FSYNC
innodb_checksum_algorithm=none
innodb_io_capacity=4000
innodb_io_capacity_max=20000
innodb_lru_scan_depth=9000
innodb_change_buffering=none
innodb_read_only=0
innodb_page_cleaners=4
innodb_undo_log_truncate=off
# perf special
innodb_adaptive_flushing=1
innodb_flush_neighbors=0
innodb_read_io_threads=16
innodb_write_io_threads=16
innodb_purge_threads=4
innodb_adaptive_hash_index=0
# monitoring
innodb_monitor_enable='%'
Configure the HammerDB Client

Download and install HammerDB on a test client system, Like PostgreSQL another 2 socket server is ideal. You need the client libraries so  ensure the MySQL 5.7 library file “libmysqlclient.so.20” is findable – you only need this one file and then run hammerdbcli to check for this file: 

export LD_LIBRARY_PATH=/home/mysql:$LD_LIBRARY_PATH
HammerDB CLI v3.1
Copyright (C) 2003-2018 Steve Shaw
Type "help" for a list of commands
The xml is well-formed, applying configuration
hammerdb>librarycheck
..
Checking database library for MySQL
Success ... loaded library mysqltcl for MySQL
 
Create the Schema and Run the Test
Just before running the schema creation double check that you have initialised mysql correctly and the mysql directory exists, otherwise the tables will be created and loaded with data but you will get the following error when creating the stored procedures
Error in Virtual User 1: mysqlexec/db server: Table 'mysql.proc' doesn't exist
an example of how to do this is as follows:
$ ./scripts/mysql_install_db --srcdir=/home/mariadb/mariadb-10.2 --defaults-file=./../my.cnf
Installing MariaDB/MySQL system tables in '/home/mariadb/data' ...
OK
If using the HammerDB CLI an example script saved as innodbbuild.tcl is shown update accordingly for your system and make sure partitioning is included:
#!/bin/tclsh
puts "SETTING CONFIGURATION"
dbset db mysql
diset connection mysql_host 192.168.1.1
diset connection mysql_port 3306
diset tpcc mysql_count_ware 800
diset tpcc mysql_partition true
diset tpcc mysql_num_vu 64
diset tpcc mysql_storage_engine innodb
print dict
buildschema
$ ./hammerdbcli
HammerDB CLI v3.1
Copyright (C) 2003-2018 Steve Shaw
Type "help" for a list of commands
The xml is well-formed, applying configuration 
hammerdb>source innodbbuild.tcl

It will return to the prompt when built – then restart the MySQL instance and run a single test. On an up to date system around mid-2018 expect to see up to 2M MySQL TPM and around 650K NOPM. 

Vuser 1:56 Active Virtual Users configured
Vuser 1:TEST RESULT : System achieved 1994844 MySQL TPM at 658082 NOPM
 Then on a load test client run a script such as the following at the command line this does the same as autopilot in the GUI so make sure you log to temp.
 
#!/bin/tclsh
proc runtimer { seconds } {
set x 0
set timerstop 0
while {!$timerstop} {
incr x
after 1000
  if { ![ expr {$x % 60} ] } {
          set y [ expr $x / 60 ]
          puts "Timer: $y minutes elapsed"
  }
update
if {  [ vucomplete ] || $x eq $seconds } { set timerstop 1 }
    }
return
}
puts "SETTING CONFIGURATION"
dbset db mysql
diset connection mysql_host 192.168.142.1
diset connection mysql_port 3307
diset tpcc mysql_driver timed
diset tpcc my_rampup 2
diset tpcc my_duration 5
vuset logtotemp 1
loadscript
puts "SEQUENCE STARTED"
foreach z { 1 2 4 8 12 16 20 24 28 32 36 40 44 48 52 56 60 64 68 72 76 } {
puts "$z VU TEST"
vuset vu $z
vucreate
vurun
runtimer 600
vudestroy
after 5000
        }
puts "TEST SEQUENCE COMPLETE"
 Test Results

Grab the TPM or NOPM from the logfile. If everything went well you should get a sequence as follows peaking at around 650,000 NOPM on an up to date system in mid-2018.  To be clear this chart shows the data from 20 performance tests, each with a 2 minute rampup time and 5 minute test. After each test completed HammerDB then increased the virtual user count and repeated the test. Fortunately HammerDB allows all of this process to be automated.  Each data point shows the average transaction rate captured over the 5 minute test so not the peak performance that may be higher. 

Note that after a point, in this case after 56 virtual users, performance will decrease as you increase the number of virtual users. This is to be expected and is due to the limitations of the scalability of the storage engine. If you report the stored procedure response times (see the HammerDB manual for how to do this) you will see the time increase especially for the DELIVERY stored procedure that is updating the ORDER_LINE table while the NEWORD stored procedure is trying to insert into it. As a result the NOPM or New Orders per minute reduces as more contention is experienced. This is not a limitation of HammerDB that has been observed to drive significantly higher transaction rates.  Nevertheless around 2M MySQL TPM is very respectable throughput for an enterprise workload and as there is a lot more CPU available the potential is there to go a lot higher. 

HammerDB Best Practice for PostgreSQL Performance and Scalability

This post gives a HOWTO guide on system configuration for achieving top levels of performance with the HammerDB PostgreSQL TPC-C test.  As an Intel employee (#IAMINTEL) the examples are taken from a PostgreSQL on Linux on Intel system, the approach is the same for whatever system you are testing although some of the settings you see may be different.
Firstly for system choice a 2 socket system is optimal for PostgreSQL OLTP performance at the time of writing. This limitation is at the database level rather than the hardware level, nevertheless with up to date hardware (from mid-2018) PostgreSQL on a 2 socket system can be expected to deliver more than 2M PostgreSQL TPM and 1M NOPM with the HammerDB TPC-C test. 

I/O

On the 2 socket system you will need I/O that is able to keep up with writing to the WAL – An example is an NVME PCIe SSD formatted as an XFS file system and mounted as below: 

/dev/nvme0n1p1                                /mnt/ssd        xfs     noatime

The OS  username you are using it can be anything but for people familair with Oracle this becomes the equivalent of the system username.  Many people use postgres.

CPU Configuration

Make sure that your CPU is configured for optimal performance. To do this make sure that the Linux tools package is installed. If so there are a number of tools under the /usr/lib/linux-tools directory under the specific kernel name. 


# ls
acpidbg  cpupower  perf  turbostat  usbip  usbipd  x86_energy_perf_policy
With these installed set the cpufreq governor to performance as follows:
# ./cpupower frequency-set --governor=performance
Setting cpu: 0
Setting cpu: 1
Setting cpu: 2
Check that the settings have been applied and the frequency settings as expected. From the following output key things to check are that the driver is shown as intel_pstate (for Intel CPUs), the governor shows as performance, the frequency range goes to the maximum frequency for the CPU and boost state is supported (if your CPU supports turbo boost). 
# ./cpupower frequency-info
analyzing CPU 0:
  driver: intel_pstate
  CPUs which run at the same hardware frequency: 0
  CPUs which need to have their frequency coordinated by software: 0
  maximum transition latency:  Cannot determine or is not supported.
  hardware limits: 1000 MHz - 3.80 GHz
  available cpufreq governors: performance powersave
  current policy: frequency should be within 1000 MHz and 3.80 GHz.
                  The governor "performance" may decide which speed to use
                  within this range.
  current CPU frequency: Unable to call hardware
  current CPU frequency: 1.99 GHz (asserted by call to kernel)
  boost state support:
    Supported: yes
    Active: yes

Also check that the idle settings are enabled and (for Intel CPUs) that the intel_idle driver is used. Note that the pstate and cstate drivers work together to provide the most efficient use of turbo boost. Initially it is best leave all of these states enabled. Disabling all C-states or Idle states is likely to reduce overall performance by reducing the available turbo frequency. You can experiment with the C-states between ‘all or nothing’ to find the optimal settings. 

# ./cpupower idle-set --enable-all
# ./cpupower idle-info
CPUidle driver: intel_idle
CPUidle governor: menu
analyzing CPU 0:
Number of idle states: 4
Available idle states: POLL C1 C1E C6
POLL:
Flags/Description: CPUIDLE CORE POLL IDLE
Latency: 0
Usage: 10736
Duration: 29182086
You are not quite done. There is another tool in the directory called x86_energy_perf_policy that determines how the boost states are used. By default this is set to normal so you will want to set it to performance. 
# ./x86_energy_perf_policy -rcpu0: EPB 6
cpu0: HWP_REQ: min 38 max 38 des 0 epp 0 window 0x0 (0*10^0us) use_pkg 0
cpu0: HWP_CAP: low 7 eff 10 guar 25 high 38
cpu1: EPB 6
# ./x86_energy_perf_policy performance
# ./x86_energy_perf_policy -rcpu0: EPB 0
cpu0: HWP_REQ: min 38 max 38 des 0 epp 0 window 0x0 (0*10^0us) use_pkg 0
cpu0: HWP_CAP: low 7 eff 10 guar 25 high 38
cpu1: EPB 0
As the name indicates the turbostat tool can be used to monitor the CPU turbo frequencies. 
Huge Page Memory Configuration

For the memory we need to set Huge Pages – so as root add the following line to /etc/sysctl.conf we are going to create 64GB of buffers by adding the vm.nr_hugepages line (Huge Pages are 2MB in size). 

vm.swappiness = 0
kernel.sem = 250 32000 100 128
fs.file-max = 6815744
net.ipv4.ip_local_port_range = 9000 65500
net.core.rmem_default = 262144
net.core.rmem_max = 4194304
net.core.wmem_default = 262144
net.core.wmem_max = 1048576
fs.aio-max-nr = 1048576
vm.nr_hugepages = 35000
 Also edit /etc/security/limits.conf and add the following:
postgres soft memlock 100000000
postgres hard memlock 100000000
Now run the command “sysctl –p” as root, when the database is running you will see the memory allocated from huge pages. 
cat /proc/meminfo
HugePages_Total:   35000
HugePages_Free:     6588
HugePages_Rsvd:     4572

To reiterate this will only be when you have reached the stage of starting the database, so firstly you will need to install the software.

Install PostgreSQL from Source
Make sure that you have the necessary software to compile PostgreSQL from source, download the postgresql source and extract it to your PostgreSQL file system configured above. Although 9.6.5 has been used here, feel free to download and use the latest release. 
postgres:/mnt/ssd/postgresqlsrc$ ls
pgsql  postgresql-9.6.5  postgresql-9.6.5.tar
 Find and change change the file pg_config.h (after having run configure first)
find . -name pg_config.h -print
./src/include/pg_config.h 

 So it looks like below, this will set the WAL file size to be 1GB instead of the default 16MB. 

/* XLOG_SEG_SIZE is the size of a single WAL file. This must be a power of 2
   and larger than XLOG_BLCKSZ (preferably, a great deal larger than
   XLOG_BLCKSZ). Changing XLOG_SEG_SIZE requires an initdb. */
#define XLOG_SEG_SIZE (1024 * 1024 * 1024)
The default location for the install is in /usr/local/pgsql so the easiest way to configure is to set a symbolic link to a directory from your ssd to this location using the “ln –s” command
 
pgsql -> /mnt/ssd/postgresqlsrc/pgsql
postgres:/mnt/ssd/postgresqlsrc$ ls -ltr /usr/local
total 32
lrwxrwxrwx 1 root root   28 Oct 11 03:41 pgsql -> /mnt/ssd/postgresqlsrc/pgsql
 
Now follow the steps previously to compile PostgreSQL from source. When you do “make install” it will create the binaries in this location.  You also need to create a new directory called “data” and if all went well you should now have a directory that looks like this:
postgres:/usr/local/pgsql$ ls
bin  data  include  lib  share
Configure PostgreSQL
Run initdb from the bin directory specifying the data directory
./bin/initdb -D ./data
This creates your database with the username of the OS user you are using as the superuser. Now edit 2 configuration files postgresql.conf and pg_hba.conf. 
For Postgresql.conf you have a number of options. It is your test so you can set the options as you see fit. Remember to set huge_pages=on and note that whereas wal_level minimal=minimal and synchronous_commit=off will give you the best WAL performance for a test it may not be what you would want in a production environment. (and you can run further tests to quantify the impact of these options). 
 
postgres:/mnt/ssd/postgresqlsrc/pgsql/data$ more postgresql.conf
listen_addresses ='192.168.1.1'              # what IP address(es) to listen on;
port = 5432                             # (change requires restart)
max_connections = 256                   # (change requires restart)
shared_buffers = 64000MB                        # min 128kB
huge_pages = on                 # on, off, or try
temp_buffers = 4000MB                   # min 800kB
work_mem = 4000MB                               # min 64kB
maintenance_work_mem = 512MB            # min 1MB
autovacuum_work_mem = -1                # min 1MB, or -1 to use maintenance_work_mem
max_stack_depth = 7MB                   # min 100kB
dynamic_shared_memory_type = posix      # the default is the first option
max_files_per_process = 4000            # min 25
effective_io_concurrency = 32           # 1-1000; 0 disables prefetching
wal_level = minimal                     # minimal, archive, hot_standby, or logical
synchronous_commit = off                # synchronization level;
wal_buffers = 512MB                     # min 32kB, -1 sets based on shared_buffers
#checkpoint_segments = 256              # in logfile segments, min 1, 16MB each
checkpoint_timeout = 1h         # range 30s-1h
checkpoint_completion_target = 1        # checkpoint target duration, 0.0 - 1.0
checkpoint_warning = 0          # 0 disables
log_min_messages = error                # values in order of decreasing detail:
log_min_error_statement = error # values in order of decreasing detail:
log_timezone = 'GB'
autovacuum = off                        # Enable autovacuum subprocess?  'on'
datestyle = 'iso, dmy'
timezone = 'GB'
lc_messages = 'en_GB.UTF-8'                     # locale for system error message
lc_monetary = 'en_GB.UTF-8'                     # locale for monetary formatting
lc_numeric = 'en_GB.UTF-8'                      # locale for number formatting
lc_time = 'en_GB.UTF-8'                         # locale for time formatting
default_text_search_config = 'pg_catalog.english'
max_locks_per_transaction = 64          # min 10
max_pred_locks_per_transaction = 64     # min 10
Also change the pg_hba.conf and add the ip addresses for your test server and load testing client running HammerDB.
# TYPE  DATABASE        USER            ADDRESS                 METHOD
# "local" is for Unix domain socket connections only
local   all             all                                     trust
# IPv4 local connections:
host    all             all             127.0.0.1/32            trust
# IPv6 local connections:
host    all             all             ::1/128                 trust
host    all             all             192.168.1.1/32        trust
host    all             all             192.168.1.2/32        trust
# Allow replication connections from localhost, by a user with the
# replication privilege.
#local   replication     postgres                                trust
#host    replication     postgres        127.0.0.1/32            trust
#host    replication     postgres       ::1/128                 trust
Start the PostgreSQL Database

Start the database as follows:

./bin/pg_ctl start -D ./data

And check it is running (remember to check the huge page allocation as well).
postgres:/usr/local/pgsql$ ps -ef | grep post
postgres    201539      1  0 Sep19 ?        00:00:00 /mnt/ssd/postgresqlsrc/pgsql/bin/postgres -D ./data
postgres    201541 201539  0 Sep19 ?        00:00:57 postgres: checkpointer process
postgres    201542 201539  0 Sep19 ?        00:00:02 postgres: writer process
postgres    201543 201539  0 Sep19 ?        00:03:18 postgres: wal writer process
postgres   201544 201539  0 Sep19 ?        00:00:04 postgres: stats collector process
You can stop the database as follows:
./bin/pg_ctl stop -D ./data
 Now login set the password for the “superuser” note how this takes the name from the OS user so in this case postgres.
postgres:/usr/local/pgsql$ ./bin/psql -U postgres -d postgres
psql (9.6.5)
Type "help" for help.
postgres=# alter role postgres password 'postgres';
ALTER ROLE
postgres=#
Use –W to test the password
postgres:/usr/local/pgsql$ ./bin/psql -U postgres -d postgres -W
Password for user postgres:
psql (9.6.5)
Type "help" for help.
postgres=#
Configure the HammerDB Client

Download and install HammerDB on a test client system, another 2 socket server is ideal. You need the client libraries so you can either copy the postgres lib directory you have just compiled or compile from source again on this host – you don’t need to create a database or set the config files. Then add the library to the library path:

postgres:~$ export LD_LIBRARY_PATH=/usr/local/pgsql/lib:$LD_LIBRARY_PATH

and check that it loads with a librarycheck test.

$ ./hammerdbcli
HammerDB CLI v3.1
Copyright (C) 2003-2018 Steve Shaw
Type "help" for a list of commands
The xml is well-formed, applying configuration
hammerdb>librarycheck
Checking database library for PostgreSQL
Success ... loaded library Pgtcl for PostgreSQL
Create the Schema and Run the Test
You can now start HammerDB on the client and from the Database options choose PostgreSQL. Follow the HammerDB documentation to build the schema and run the test. Do not select the EnterpriseDB Oracle compatible schema as you installed the software from source. Creating an 800 Warehouse schema is a good starting point, the data should load quickly but note that creating indexes can take up to 20 mins or so this is to be expected. If you have a system with an up to date CPU (as of mid-2018), enough memory and everything installed on a fast SSD then more than 2M PostgreSQL TPM and more than 1M NOPM should be achievable.

HammerDB command line build and test examples

With the HammerDB command line its very easy to script the schema build and automated test so that if you don’t have a GUI or don’t want to use one you can still access all of the HammerDB functionality. The following example is with MySQL on Linux but can easily apply to any database you choose.

Firstly if you don’t have MySQL installed copy the client library to your home directory

$ ls -l libmysqlclient.so.20
-rw-r--r-- 1 mysql mysql 4237408 Apr 23 09:21 libmysqlclient.so.20
and add it to your path
$ export LD_LIBRARY_PATH=/home/intel:$LD_LIBRARY_PATH
The CLI command librarycheck will verify if the library can be loaded.
$ ./hammerdbcli
HammerDB CLI v3.1
Copyright (C) 2003-2018 Steve Shaw
Type "help" for a list of commands
The xml is well-formed, applying configuration
hammerdb>librarycheck
...
Checking database library for MySQL
Success ... loaded library mysqltcl for MySQL
...
Using a text editor create a script with your configuration, such as follows. Note that in this example the build is going to be run on the database server itself.
$ more schemabuild.tcl
#!/bin/tclsh
puts "SETTING CONFIGURATION"
dbset db mysql
diset connection mysql_host 127.0.0.1
diset connection mysql_port 3306
diset tpcc mysql_count_ware 800
diset tpcc mysql_partition true
diset tpcc mysql_num_vu 64
diset tpcc mysql_storage_engine innodb
print dict
buildschema
Then run the hammerdb CLI and type source schemabuild.tcl – hammerdb will then run the build you specified.
$ ./hammerdbcli
HammerDB CLI v3.1
Copyright (C) 2003-2018 Steve Shaw
Type "help" for a list of commands
The xml is well-formed, applying configuration
hammerdb>source schemabuild.tcl
To run the test you can configure a script to automate a sequence of tests just like the autopilot feature in the GUI. This example runs tests from 1 right through to 104 virtual users. Note in this case the driver is now being run from a client system (remember to install the client library and check that it loads here as well) and logtotemp is set so that all of the output is captured to a file.
$ more mysqlrun.tcl
#!/bin/tclsh
proc runtimer { seconds } {
set x 0
set timerstop 0
while {!$timerstop} {
incr x
after 1000
  if { ![ expr {$x % 60} ] } {
          set y [ expr $x / 60 ]
          puts "Timer: $y minutes elapsed"
  }
update
if {  [ vucomplete ] || $x eq $seconds } { set timerstop 1 }
    }
return
}
puts "SETTING CONFIGURATION"
dbset db mysql
diset connection mysql_host 192.168.1.1
diset connection mysql_port 3306
diset tpcc mysql_driver timed
diset tpcc my_rampup 2
diset tpcc my_duration 5
vuset logtotemp 1
loadscript
puts "SEQUENCE STARTED"
foreach z { 1 2 4 8 12 16 20 24 28 32 36 40 44 48 52 56 60 64 68 72 76 80 84 88 92 96 100 104 } {
puts "$z VU TEST"
vuset vu $z
vucreate
vurun
runtimer 600
vudestroy
after 5000
        }
puts "TEST SEQUENCE COMPLETE"
Then as above run the script, it will now run the script unattended executing the sequence of tests.
$ ./hammerdbcli
HammerDB CLI v3.1
Copyright (C) 2003-2018 Steve Shaw
Type "help" for a list of commands
The xml is well-formed, applying configuration
hammerdb>source mysqlrun.tcl
That’s all you need to build a schema and run a sequence of tests with HammerDB without the GUI.

HammerDB Best Practice for SQL Server Performance and Scalability

With the move to HammerDB v3.0 as well as refactoring a lot of code the documentation moved to Docbook format. As with the Oracle best practice dcoument previously at v2 there was an SQL Server best practice document that is no longer included in the current documentation. As a number of people have asked for it it is published here. 
CPU, Memory and I/O
The key dependence of performance is hardware related with the CPU being the most important factor on the levels of performance available from the rest of the system. At the next level from the CPU is memory with the best levels of performance available from having sufficient memory to cache all of the test database. Finally I/O performance is crucial with modern systems and CPUs available to drive high levels of throughput, In particular for OLTP workloads write performance to transaction logs is critical and often a major resource constraint.  Solid State Disks (SSDs) are strongly recommended for both data areas and transaction logs to provide the I/O capabilities to match the CPU performance of up to date systems.
BIOS Settings
 Systems are shipped with default BIOS and are not necessarily optimized for database performance.  BIOS settings should be checked and settings verified with the vendor to ensure that they are advantageous to SQL Server Performance. A common error is to accept a default setting of “High Performance” that sets a subset of lower level BIOS settings without verifying what these are.  A default setting of “High Performance” will often result in lower performance for a database environment.
Power Options
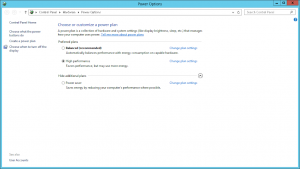
Open the power options dialog and choose High Performance if not already selected.
 Verify Single Threaded Performance
Verify that you achieve maximum CPU single threaded performance by creating and running the following stored procedure.
USE [tpcc]
GO
SET ANSI_NULLS ON
GO
CREATE PROCEDURE [dbo].[CPUSIMPLE] 
AS
   BEGIN
      DECLARE
         @n numeric(16,6) = 0,
         @a DATETIME,
         @b DATETIME
      DECLARE
         @f int
      SET @f = 1
      SET @a = CURRENT_TIMESTAMP
      WHILE @f <= 10000000 
         BEGIN
      SET @n = @n % 999999 + sqrt(@f)
            SET @f = @f + 1
         END
         SET @b = CURRENT_TIMESTAMP
         PRINT ‘Timing = ‘ + ISNULL(CAST(DATEDIFF(MS, @a, @b)AS VARCHAR),)
         PRINT ‘Res = ‘+ ISNULL(CAST(@n AS VARCHAR),)
   END
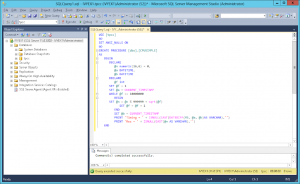
In any database (ie use [ database name ] ) create the stored procedure by running the code above as shown.
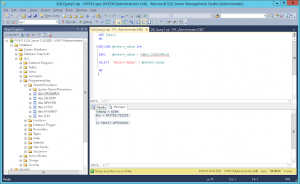
Right click on CPUSIMPLE and click execute stored procedure, Click OK and wait – if it runs OK then return value is 0  click on message to see the time the procedure took to run:
For example:
Timing = 8250
Res = 873729.721235
(1 row(s) affected)
In this case the stored procedure took 8.2 seconds to run. Actual performance will depend on your installed CPU however an up to date CPU would be expected to complete this routine in under 10 seconds. For more information on this test and troubleshooting view the older blog entry How to Maximise CPU Performance for SQL Server on Windows.
Network Bandwidth
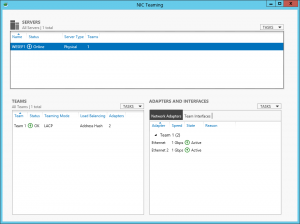
With a highly scalable system network utilisation may exceed Gigabit capacity between log generation server and SUT.  To increase capacity you may use either use 10GbE or configure NIC teaming for multiple Gigabit Ethernet adapters on both the server and both the LACP compatible switch in LACP mode.   Firstly the network switch must be configured to enable LACP using your switch documentation, then configure NIC teaming from the Server Management Window for the interfaces connected to the same switch as shown
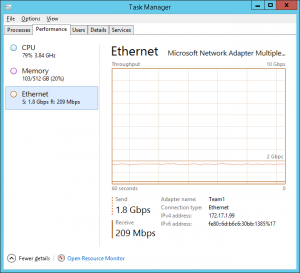
Confirm under Task Manager that Gigabit capacity has been exceeded whilst running a HammerDB workload.
SQL Server Properties

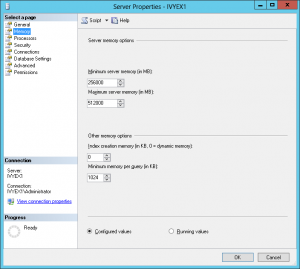
Configure SQL Server according to your available hardware, this can be done either with the graphical tools as shown or manually as follows, the following example shows a memory configuration of between 256GB and 512GB.
 
exec sp_configure ‘show advanced options’, ‘1’
reconfigure with override
exec sp_configure ‘min server memory’, 256000
exec sp_configure ‘max server memory’, 512000
exec sp_configure ‘recovery interval’,’32767′
exec sp_configure ‘max degree of parallelism’,’1′
exec sp_configure ‘lightweight pooling’,’1′
exec sp_configure ‘priority boost’, ‘1’
exec sp_configure ‘max worker threads’, 3000
exec sp_configure ‘default trace enabled’, 0
go
reconfigure with override
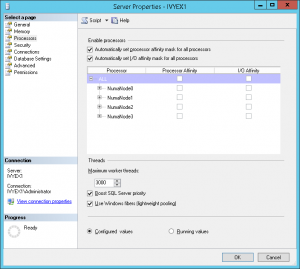
Also ensure that Processor Affinity is set automatically as shown.
 
Database Creation
Building the HammerDB schema directly on the database server will be quicker as you will be able to take advantage of more cores and not be required to pass all of the data across the network.
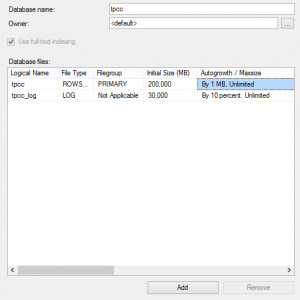
Firstly pre-create an empty database called tpcc (or any other name) as shown, this enables you to choose and configure your storage in advance. Ensure that the initial DATA files are sufficiently large (eg 200GB for 4 socket) to ensure that the files are not continually growing during a test at the expense of performance. You may also wish to configure the Autogrowth properties to ensure that if the file does grow it grows sufficiently to prevent additional performance impact.
Schema Build and Configure
Once built backup the TPCC database, a simple way is to stop SQL Server and copy the TPCC DATA and LOG to a backup directory. To restore the schema delete the existing schema, copy the DATA and LOG directories from backup and use the attach command to reattach the original database, configure the schema using the following commands.
ALTER DATABASE tpcc SET RECOVERY SIMPLE
GO
ALTER DATABASE tpcc SET TORN_PAGE_DETECTION OFF
GO
ALTER DATABASE tpcc SET PAGE_VERIFY NONE
GO
Partition the History Table
For highly scalable systems partitioning the history table can reduce insert contention either use the SQL Server Management Studio or run a statement as follows modifying the highlighted values according to the warehouse count for 1 partition per 100 warehouses.
USE [tpcc]
GO
BEGIN TRANSACTION
CREATE PARTITION FUNCTION[HISTORY_PART](int) AS RANGE LEFT FOR VALUES (1, 100,200, 300, 400, 500, 600, 700, 800, 900)
CREATE PARTITION SCHEME[HISTORY_PART] ASPARTITION [HISTORY_PART]TO ([PRIMARY],[PRIMARY],[PRIMARY],[PRIMARY],[PRIMARY],[PRIMARY],[PRIMARY],[PRIMARY],[PRIMARY],[PRIMARY],[PRIMARY])
CREATE CLUSTERED INDEX[ClusteredIndex_on_HISTORY_PART_634589363881526517]ON [dbo].[history]
(
       [h_w_id]
)WITH (SORT_IN_TEMPDB = OFF, IGNORE_DUP_KEY = OFF, DROP_EXISTING = OFF, ONLINE = OFF) ON [HISTORY_PART]([h_w_id])
COMMIT TRANSACTION
Resize the Transaction Log
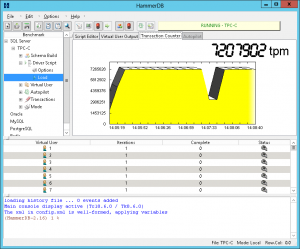
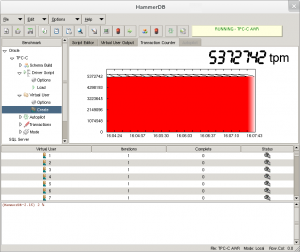
 As the recovery interval has already been set to the maximum permitted a checkpoint will occur when the transaction log is 70% full, at high performance depending on the I/O write performance to your data files, the checkpoint produce an I/O effect noticeable in the HammerDB transaction counter as follows:
To observe the checkpoint set DBCC trace 3502, 3504 and 3605 and open the error log.
2014-01-15 14:04:35.18 spid56      DBCC TRACEON 3502, server process ID (SPID) 56. This is an informational message only; no user action is required.
2014-01-15 14:06:52.74 spid56      DBCC TRACEON 3504, server process ID (SPID) 56. This is an informational message only; no user action is required.
2014-01-15 14:06:52.74 spid56      DBCC TRACEON 3605, server process ID (SPID) 56. This is an informational message only; no user action is required.
The following example shows that the checkpoint took 14.7 seconds writing at 1GB/sec that coincided with the drop in performance.
2014-01-16 11:41:11.75 spid20s     FlushCache: cleaned up 1932082 bufs with 948934 writes in 14739 ms (avoided 25317 new dirty bufs) for db 5:0
2014-01-16 11:41:11.75 spid20s                 average throughput: 1024.11 MB/sec, I/O saturation: 418155, context switches 562834
2014-01-16 11:41:11.75 spid20s                 last target outstanding: 31729, avgWriteLatency 26
2014-01-16 11:41:11.75 spid20s     About to log Checkpoint end.
To postpone the checkpoint until after the test, resize the logfile. Being too small will cause checkpoints before the test is complete – too large impact will performance – the following example resizes the logfile to 64GB.
use tpcc
dbcc shrinkfile(‘tpcc_log’,truncateonly)
alter database tpcc modify file (name=‘tpcc_log’, size=64000)
dbcc loginfo(‘tpcc’)
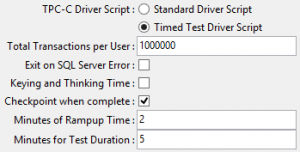
Select Checkpoint when complete to checkpoint after the timed test has completed.
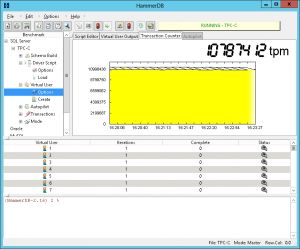
Observe performance for an entire test to ensure that the transaction counter is level showing that SQL Server performance is consistent without a drop in performance for checkpoints.
Monitoring
Use the Open Source Fusion-IO MS SQL Server scripts to identify the resource constraints. In this example WRITELOG is the main constraint and therefore adding LOG write I/O capacity is the best method to improve performance (as CPU is not saturated).
If the CPU is saturated on a single load generation client (and not the SUT Server) then multiple load test clients can be used using the “Master-Slave” functionality to drive a load from 2 clients simultaneously.   If the CPU is not saturated on the Server without having identified other resource constraints such as I/O or network then increase the Virtual User count on the load generation client.
Processor Group Affinity
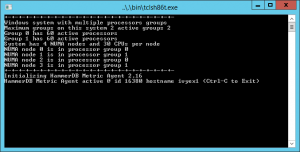
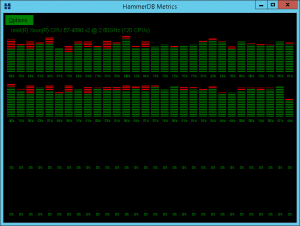
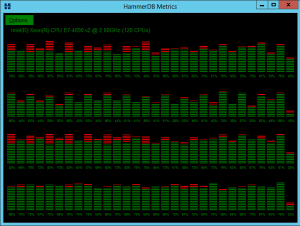
Windows Server 2008 and prior releases supported up to 64 CPUs only. Windows Server 2008 R2, 2012 and 2012 R2 supports up to 256 processors however divides these processors up into processor groups of 64 processors with handling of processor groups improving with each release of Windows.  For example with 120 logical processors Windows Server 2012 R2 presents these CPUs as 2 Processor Groups of 60 logical processors each. HammerDB Metrics can be used to illustrate the usage of Processor Groups by SQL Server as shown.
Most applications (including the HammerDB client are restricted to operating within a single processor group). SQL Server is able to operate across multiple Processor Groups however may restrict client connections to a single Processor Group or subset of Processor Groups for an individual test.
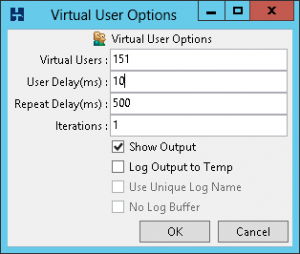
Once initially assigned sessions do not move between Processor Groups and therefore performance and CPU utilisation may be artificially limited.  Using the FusionIO Monitoring Scripts previously referenced when this Processor Group limitation occurs the top wait event is shown as “Threading and CPU”.   When running a test the aim is to achieve an even distribution of CPU utilization across all processors to result in good performance. Processor Group allocation is affected by modifying the allocation time.  To achieve this balance, in the HammerDB virtual user options modify the User Delay parameter to 10ms, this means that the user will wait for 10ms after the previous user logged on.
A shortened connection time typically ensures an even distribution of connections across the server. Use the HammerDB Metrics tool  to monitor the system to ensure good utilisation of system resources.


HammerDB Best Practice for Oracle Performance and Scalability

With the move to HammerDB v3.0 as well as refactoring a lot of code the documentation moved to Docbook format. Previously at v2 there was an Oracle best practice document that is no longer included in the current documentation although a number of people have asked for it.  Nevertheless lot of this information remains relevant to HammerDB v3.0 and v3.1 including gathering a number of links to older blog posts focusing on specific areas such as CPU, Memory and I/O. Working through this base configuration information can give a significant head start in configuring an Oracle Database to get the best results from HammerDB. As an Intel employee (#IAMINTEL) the examples are taken from Oracle on Linux on Intel although the approach is the same for whatever system you are testing.
CPU, Memory and I/O
The key dependence of performance is hardware related with the CPU being the most important factor on the levels of performance available from the rest of the system. At the next level from the CPU is memory with the best levels of performance available from having sufficient memory to cache all of the test database. Finally I/O performance is crucial with modern systems and CPUs available to drive high levels of throughput, In particular for OLTP workloads write performance to transaction logs is critical and often a major resource constraint.  Solid State Disks (SSDs) are strongly recommended for both data areas and redo logs to provide the I/O capabilities to match the CPU performance of up to date systems.
BIOS Settings
Systems are shipped with default BIOS and are not necessarily optimized for database performance.  BIOS settings should be checked and settings verified with the vendor to ensure that they are advantageous to Oracle Performance. A common error is to accept a default setting of “High Performance” that sets a subset of lower level BIOS settings without verifying what these are.  A default setting of “High Performance” will often result in lower performance for a database environment.
Power Saving
Modern CPUs and systems running Linux are designed to offer high levels performance whilst incorporating power saving features such as Turbo Boost and C-state and P-state management.  Firstly you should ensure that your version of Linux paying particular attention to the kernel version is compatible with the CPU in your system. You should not assume full compatibility until verified.  Once you have done this check the features of your CPU model and verify your configuration of the scaling governor and energy performance bias with tools such as PowerTop and turbostat. Full details on how to do this are provided in the blog post How to Maximise CPU Performance for the Oracle Database on Linux.
Verify Single Threaded Performance
Once you have set your BIOS settings and Power Saving settings verify that you achieve maximum CPU single threaded performance by creating and running the following stored procedure:
SET SERVEROUTPUT ON 
SET TIMING ON 
DECLARE 
n NUMBER := 0; 
BEGIN 
FOR f IN 1..10000000 
LOOP 
n := MOD (n,999999) + SQRT (f); 
END LOOP; 
DBMS_OUTPUT.PUT_LINE ('Res = '||TO_CHAR (n,'999999.99')); 
END; 
/ 
More details on running this test are here Testing C-State Settings and Performance with the Oracle Database on Linux. The test will produce a result such as follows where the elapsed time is important.
Res = 873729.72
PL/SQL procedure successfully completed.
Elapsed: 00:00:07.88

Results will vary according to CPU model however typically a modern CPU will complete this test in 10 seconds or less according to configuration ensuring both system and Linux power saving settings are set optimally for Oracle performance. 

Hyper-Threading
Previously you will have determined your CPU features. One CPU feature that may be available is Hyper-Threading.  If this feature is available it should be enabled and under a correctly configured system will result in a performance gain.  Details on the benefits of Hyper-Threading are available here Hyper-Threading On or Off for Oracle?
Memory
Correctly configuring memory is essential to Oracle performance.  On Linux you should ensure that you have your Oracle memory correctly configured for Huge Pages (Not transparenthuge pages). Follow the guide detailed here to ensure that your memory is correctly configured.  Configuring Memory for Oracle on Linux
I/O and SSDs
After correctly configuring memory your focus should be on I/O or disk performance. This focus lies in 2 areas firstly the data area defined by the tablespace or tablespaces you create to configure your schema and secondly the redo logs.  For both data and redo the best performance available is from good quality and correctly configured SSDs (solid state disks). Further information on SSDs is available in the post Should you put Oracle Database Redo on Solid State Disks (SSDs)?.  Configuring the data area should be done in conjunction with configuring memory for the buffer cache. With sufficient memory you can expect most of your data blocks to be cached and therefore interaction with the data area until a checkpoint occurs may be minimal. On the other hand an OLTP workload will continually write to the redo log file and throughput should be high and latency low (< 1ms) to achieve the highest transaction numbers.   With SSDs careful consideration should be given to setup and Linux Database Performance on SSD 910 with Filesystemdetail how this should be done.
Network Bandwidth
Oracle OCI is network efficient and issues should not be found with high throughput even on a typical Gigabit Ethernet network. If system network utilisation does exceed Gigabit capacity between load generation server and SUT to increase capacity you may use either use 10GbE or configure NIC teaming for multiple Gigabit Ethernet adapters on both the server and both the LACP compatible switch in LACP mode.   
Oracle Parameters
Your Oracle parameters will vary according to the size and configuration of your system and therefore there is no single recommend Oracle parameter file.  Nevertheless standard best practice includes sizing shared memory manually rather than automatically and disabling database features that are not currently in use.
 As an example the following white paper shows a configuration file used for a large high performance system Mission-Critical Database Performance: Intel Xeon Processor E7 V2 Family vs. Ibm Power7+.
Database Creation
Building the HammerDB schema directly on the database server will be quicker as you will be able to take advantage of more cores and not be required to pass all of the data across the network. You should already have your database software installed and Oracle running.  Before running the schema creation create the tablespace required for your data area.  Ensure that this file is suitably large not to autoextend and to allow for sufficient table growth during tests.
Schema Build and Configure
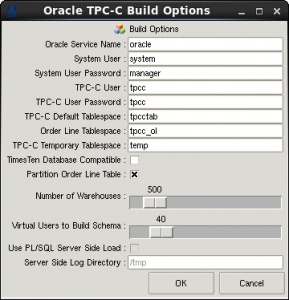
If you select a schema of more than 200 warehouses the option to partition the order line becomes available. When running on larger systems selecting this option will enable high levels of scalability. Additionally there is the option to select a separate order line tablespace from the tablespace where the other tables are located and therefore also to create this tablespace with a separate block size.  Previously the Oracle parameter to create a separate cache for this block size will have been chosen. For example:
db_16k_cache_size=32749125632
As the order line tablespace is an IOT (index organized table) for highly scalable systems this will benefit from choosing a larger blocksize for this tablespace such as 16k with a standard blocksize used of 8k. This has the effect of reducing the height of the IOT and lower the number of index block splits resulting in higher performance.
Resize the Redo Log Files
The importance of correctly sizing the redo logs cannot be understated. The sizing of your redo logs is related to checkpointing activity and further details on Oracle checkpoints are described here What’s the Point of Oracle Checkpoints?.  When your Oracle database checkpoints it will trigger the database writers to flush the modified data blocks from the buffer cache back to disk.  In particular if Oracle needs to wait to reassign a redo log containing changes not yet written to disk a message of “Checkpoint not complete” will be recorded in the alert log and the database will stop processing transaction until it is complete.  It is recommended to set the following Oracle parameter to monitor all checkpoint activity in the alert log.
log_checkpoints_to_alert=TRUE
Depending on your I/O capacity this may impact performance. A checkpoint may occur as a result of a redo log switch depending on the contents of that redo log at the time. Recommended redo log file parameters to ensure this behaviour are:
fast_start_mttr_target=0
log_checkpoint_interval=0
log_checkpoint_timeout=0
 Nevertheless redo log files (especially from an OLTP test) cannot be sized too large and an effective strategy is to use the data from Oracle to size 2 or more redo log files large enough to delay checkpointing until the end of the test.  For example the following extract of a load profile from an AWR report shows a redo rate of 405MB per second. 
Load Profile                    Per Second   Per Transaction  Per Exec  Per Call
~~~~~~~~~~~~~~~            ---------------   --------------- --------- ---------
             DB Time(s):               0.0               0.0      0.00      0.00
              DB CPU(s):               0.0               0.0      0.00      0.00
      Redo size (bytes):     405,860,130.7           5,345.2
  Logical read (blocks):       7,892,009.8             103.9
          Block changes:       2,377,433.9              31.3
Consequently depending on the contents of the other redo log files a log switch checkpoint could be triggered at the end of a 25GB redo log file every minute and therefore a redo log size of 250GB in size would be configured for a 10 minute test.  Use the views v$LOG and V$LOGFILE to correctly size the redo logs.  Note that if you select “Checkpoint when complete” in the Driver Options a full checkpoint and a redo log switch will be triggered after a test is complete, resetting Oracle to start the next test at the start of the next redo log file in sequence.
As shown observe performance for an entire test to ensure that the transaction counter is level showing that Oracle performance is consistent without a drop in performance for checkpoints.
Monitoring
HammerDB Metrics provides a reliable way to monitor CPU performance on every core in your system. Maximum performance will be achieved when every core is fully utilised as shown in Figure 4.  However it is not necessarily the case that full utilisation means maximum performance has been achieved. It is possible for misconfiguration to mean that CPU utilisation is high yet throughput is low due to contention.
HammerDB provides the facility to automatically generate AWR reports that correspond with the OLTP workload. Therefore these AWR reports should be your primary tuning tool to ensure that your Oracle environment is correctly configured. As shown the first point if reference should be the Top Foreground Events and you should aim for DB CPU as a percentage of time over 90% as shown to coincide with the OS report of CPU utilisation as shown in Figure 4 with HammerDB Metrics.
 
Top 10 Foreground Events by Total Wait Time
Event
Waits
Total Wait Time (sec)
Wait Avg(ms)
% DB time
Wait Class
DB CPU
30.1K
96.9
library cache: mutex X
936,935
364.2
0
1.2
Concurrency
cursor: pin S
210,234
315.5
2
1.0
Concurrency
enq: TX – row lock contention
212,383
228.2
1
.7
Application
log file sync
28,919
82.3
3
.3
Commit
latch: In memory undo latch
693,091
82.3
0
.3
Concurrency
db file sequential read
55,642
46.4
1
.1
User I/O
buffer busy waits
222,183
23.5
0
.1
Concurrency
latch: enqueue hash chains
11,122
14.1
1
.0
Other
SQL*Net message to client
13,132,309
12.1
0
.0
Network
If this is not achievable use the rest of the AWR report to diagnose performance, in particular as shown CPU time and elapsed time should be checked to be as close together as possible for maximum efficiency. If not then it is necessary to determine the reason why this is not the case ans what accounts for the additional elapsed time.
CPU Time (s)
Executions
CPU per Exec (s)
%Total
Elapsed Time (s)
%CPU
%IO
SQL Id
SQL Module
SQL Text
15,894.75
5,704,467
0.00
52.73
19,048.04
83.45
0.01
wish8.6@wesep1.example.com (TNS V1-V3)
begin neword(:no_w_id, :no_max…
3,663.11
571,496
0.01
12.15
3,946.36
92.82
0.00
wish8.6@wesep1.example.com (TNS V1-V3)
BEGIN delivery(:d_w_id, :d_o_c…
On very high performance systems if contention is observed in the library cache then the markhot package can be used to reduce this.
More posts are planned on advanced performance tuning.

How to use Python with HammerDB

HammerDB is written in Tcl rather than Python for very specific reasons regarding thread scalability and the reasons are very well explained in this article Threads Done Right… With Tcl. Nevertheless a common question is whether it is possible to use Python with HammerDB? and the answer is Yes, in fact it is pretty straightforward to extend HammerDB using a package called tclpython available here https://github.com/amykyta3/tclpython. The following example is from Red Hat 7.5. 
Firstly download tclpython from github and extract the files
[root@vulture tclpython-master]#
build  LICENSE  Makefile  msvc  pkg  README.md  src  test  VERSION.md
Then install python and tcl devel packages. Note that on Red Hat 7.5 this will be Tcl 8.5 however the compiled package will still work with HammerDB that uses Tcl 8.6.
[root@vulture ~]# sudo yum install python-devel tcl-devel
Loaded plugins: langpacks, ulninfo
Package python-devel-2.7.5-69.0.1.el7_5.x86_64 already installed and latest version
...
Then compile tclpython.
[root@vulture tclpython-master]# make
cc -o build/tclpython/tclpython/tclpython.so.5.0 build/tclpython/src/tclpython.o build/tclpython/src/py.o -shared -s -lpthread -ldl -lutil -lm -lpython2.7 -ltclstub8.5
If everything goes right you should see the library in the tclpython directory as follows. Note that this is for Python 2 as by default Python 3 is not installed on Red Hat 7.5 (although this can be installed on Red Hat and tclpython built with Python 3 if you wish).
/home/oracle/tclpython-master/build/tclpython/tclpython
[oracle@vulture tclpython]$ ls
pkgIndex.tcl  tclpython.so.5.0
Copy this directory and its contents to the HammerDB lib directory so you have the library and the pkgIndex file.
[oracle@vulture lib]$ ls tclpython/
pkgIndex.tcl  tclpython.so.5.0
You can now create an interpreter with Python and run the example commands
[oracle@vulture HammerDB-3.1]$ ./hammerdbcli 
HammerDB CLI v3.1
Copyright (C) 2003-2018 Steve Shaw
Type "help" for a list of commands
The xml is well-formed, applying configuration
hammerdb>package require tclpython
5.0
hammerdb>set interpreter [python::interp new]
python0
hammerdb>$interpreter exec {print("Hello World")}
Hello World
hammerdb>puts [$interpreter eval 3/2.0]
1.5
hammerdb>python::interp delete $interpreter
hammerdb>exit
Using this method you can use Python to add your own functions to the driver scripts or write your own testing scripts. Note that in the HammerDB GUI there is functionality to capture any output written to stdout and direct it to the appropriate virtual user output and therefore any use of print in Python needs to do the same or output will be written to the command line where HammerDB was called.