How to add your database to HammerDB – Pt1 Opening an issue

A very common request is for HammerDB to add support for a new database. Before reaching out with a request your first reference should be the DB-Engines Ranking  to gauge the relative popularity of a database.  it is no coincidence that HammerDB supports the most popular databases with all of the databases currently supported being in the top 10 of this ranking.  There may be compelling reasons to add a new database outside of the top 10 to HammerDB, however clearly the HammerDB developers cannot add and maintain support for them all. Therefore this series of posts explains how any contributor can add support for a new database in HammerDB.

Firstly you will need both the source code from the HammerDB GitHub site  and the binaries for your chosen platform for testing.   Note that the key difference between the source code download and the binaries is the addition of the bin and lib directories in the binaries.  Any changes that you make to the source download can be run on your chosen platform by adding these bin and lib directories to the source or functionally equivalent keeping the binary download as a test directory and copying the modified source here over the existing files to test any changes you have made.

While on the subject of the lib directories one important aspect to consider before you begin making changes is the compiled library interface that you are going to use to communicate with your new database.  Using MySQL as an example if you load the driver script you can see the following lines:

set library mysqltcl ;# MySQL Library
...if [catch {package require $library} message] { error "Failed to load $library - $message" }

The package require line loads the compiled library from the lib directory, in this case the library in the lib/mysqltcl3.052 directory.  Looking for example in this directory on Windows there is the file libmysqltcl.dll – opening this file in an application such as dependency walker shows that this file also requires the MySQL client library libmysql.dll.  This library provides the interface between HammerDB and the TCL language it uses and the database provided client library.  The source code for this interface is here and all intefaces used are open source and GPL compliant. (Note for clarity it is the TCL interface that must be open source rather than the database client library itself) Therefore you have a choice as to whether you use an existing interface already provided in HammerDB, an interface for your database already written that you will compile and put in your test lib directory, write a new interface or use the generic provided ODBC interface. If the later is a consideration then you should use the TDBC interface that is already provided with HammerDB.   As an example although not currently visible in HammerDB the previosuly supported Trafodion database was interfaced with TDBC and is still present in the src directory. Therefore this can provide an example of adding a new database with TDBC.

If you plan for your database to be included in a HammerDB release then you will need to ensure that the client library you use works on both Linux and Windows and that the interface is open source.

Once you have decided to go ahead and add support for a new database to HammerDB and have a working client for Linux and Windows go ahead and create an Issue on theTPC  GitHub site  this will show to the HammerDB developers and others that you are considering adding support for a new database and provide the opportunity for discussion of your plans.  It is also a place to reach out for help if you get stuck. For an example there is an existing Issue to add MariaDB as a separate database on the HammerDB site.

Therefore this example series of posts will take the steps to show how to add support for this database.

Using HammerDB as a Web Service

HammerDB already has 2 interfaces with which to interface with the commands to build and test databases using the GUI interface or CLI. From HammerDB version 3.2 there is an additional interface that enables HammerDB to run as Web Service. This allows HammerDB to be driven with a REST type client using a HTTP interface to call and retrieve output from the CLI commands.  Additional  json, rest and huddle packges have been added with which to format and process input and output.  This interface can be started using the hammerdbws command at which hammerdb will proceed to listen on a predefined port. (see the documentation for setting the port). 

$ ./hammerdbws 
HammerDB Web Service v3.2
Copyright (C) 2003-2019 Steve Shaw
Type "help" for a list of commands
The xml is well-formed, applying configuration
Initialized new SQLite in-memory database
Starting HammerDB Web Service on port 8080
Listening for HTTP requests on TCP port 8080

Using a browser to navigate to that port will show the help screen.
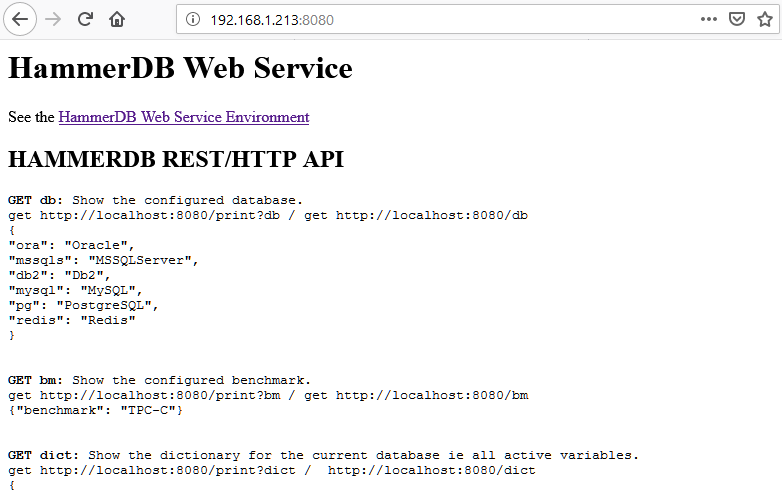
It is important to note that scripts written to drive this interface can be written in any language of choice. When using TCL the additional packages provided can be used for formatting. The following test script shows how this interaction can be done also including deliberate errors to demonstrate error handling.


$ more restchk.tcl
#!/bin/sh
#########################################################################
## \
export LD_LIBRARY_PATH=./lib:$LD_LIBRARY_PATH
## \
export PATH=./bin:$PATH
## \
exec ./bin/tclsh8.6 "$0" ${1+"$@"}
########################################################################
set UserDefaultDir [ file dirname [ info script ] ]
::tcl::tm::path add "$UserDefaultDir/modules"
package require rest
package require huddle
puts "TEST DIRECT PRINT COMMANDS"
#clear any existing script
set res [rest::post http://localhost:8080/clearscript "" ]
puts "--------------------------------------------------------"
foreach i {db bm dict script vuconf vucreated vustatus datagen} {
puts "Printing output for $i and converting JSON to text"
set res [rest::get http://localhost:8080/$i "" ]
puts "JSON format"
puts $res
puts "TEXT format"
set res [rest::format_json $res]
puts $res
}
puts "--------------------------------------------------------"
puts "PRINT COMMANDS COMPLETE"
puts "--------------------------------------------------------"
puts "TEST PRINT COMMANDS AS OPTION TO PRINT ie print?dict "
foreach i {db bm dict script vuconf vucreated vustatus datagen} {
puts "Printing output for $i and converting JSON to text"
set res [rest::get http://localhost:8080/print?$i "" ]
puts "JSON format"
puts $res
puts "TEXT format"
set res [rest::format_json $res]
puts $res
}
puts "PRINT COMMANDS COMPLETE"
puts "--------------------------------------------------------"
puts "TEST DISET"
puts "Setting Warehouse Count to 800"
set body { "dict": "tpcc", "key": "count_ware", "value": "800" }
set res [rest::post http://localhost:8080/diset $body ]

puts "Setting password to new password"
set body { "dict": "tpcc", "key": "tpcc_pass", "value": "new_password" }
set res [rest::post http://localhost:8080/diset $body ]

puts "Setting password error 1 invalid string"
set body { "dict": "tpcc", "ke }
set res [rest::post http://localhost:8080/diset $body ]
puts $res

puts "Setting password error 2 invalid number of arguments"
set body { "dict": "tpcc" }
set res [rest::post http://localhost:8080/diset $body ]
puts $res

puts "Setting password error 3 invalid key"
set body { "dict": "tpcc", "key": "tpcds_pass", "value": "new_password" }
set res [rest::post http://localhost:8080/diset $body ]
puts $res

puts "Setting password error 4 invalid string"
set body { "dict": "tpcfg", "key": "tpcds_pass", "value": "new_password" }
set res [rest::post http://localhost:8080/diset $body ]
puts $res

puts "Setting Driver Script"
set body { "dict": "tpcc", "key": "ora_driver", "value": "timed" }
set res [rest::post http://localhost:8080/diset $body ]
puts $res

puts "Setting Driver Script Error"
set body { "dict": "tpcc", "key": "ora_driver", "value": "timid" }
set res [rest::post http://localhost:8080/diset $body ]
puts $res

puts "Clearscript"
set res [rest::post http://localhost:8080/clearscript "" ]
puts $res

puts "Loadscript"
set res [rest::post http://localhost:8080/loadscript "" ]
puts $res
set res [rest::get http://localhost:8080/print?script "" ]
#uncomment to print script
#puts $res
puts "Script in TEXT format"
set res [rest::format_json $res]
#uncomment to print script
#puts $res

puts "VU Status"
set res [rest::get http://localhost:8080/vustatus "" ]
puts $res

puts "Testing dbset"
set body { "db": "mssqs" }
set res [ rest::post http://localhost:8080/dbset $body ]
puts $res

puts "Testing dbset"
set body { "dx": "mssqls" }
set res [ rest::post http://localhost:8080/dbset $body ]
puts $res

puts "Testing dbset"
set body { "db": "pg" }
set res [ rest::post http://localhost:8080/dbset $body ]
puts $res

puts "Testing dbset"
set body { "bm": "TPC-X" }
set res [ rest::post http://localhost:8080/dbset $body ]
puts $res

puts "Testing dbset"
set body { "bm": "TPC-H" }
set res [ rest::post http://localhost:8080/dbset $body ]
puts $res

puts "Testing vuset"
set body { "vuxx": "109" }
set res [ rest::post http://localhost:8080/vuset $body ]
puts $res

puts "Testing vuset"
set body { "vu": "10" }
set res [ rest::post http://localhost:8080/vuset $body ]
puts $res

puts "Testing dgset"
set body { "directory": "/home/oracle" }
set res [ rest::post http://localhost:8080/dgset $body ]
puts $res

puts "Testing Custom Script : Open File convert to JSON and post"
set customscript "testscript.tcl"
set _ED(file) $customscript
if {$_ED(file) == ""} {return}
if {![file readable $_ED(file)]} {
puts "File \[$_ED(file)\] is not readable."
return
}
if {[catch "open \"$_ED(file)\" r" fd]} {
puts "Error while opening $_ED(file): \[$fd\]"
} else {
set _ED(package) "[read $fd]"
close $fd
}
set huddleobj [ huddle compile {string} "$_ED(package)" ]
set jsonobj [ huddle jsondump $huddleobj ]
set body [ subst { {"script": $jsonobj}} ]
set res [ rest::post http://localhost:8080/customscript $body ]
puts $res
set res [rest::get http://localhost:8080/print?script "" ]
#uncomment to print script
#puts $res
puts "Custom Script in TEXT format"
set res [rest::format_json $res]
#uncomment to print script in text
#puts $res

puts "Testing vuset"
set body { "vu": "5" }
set res [ rest::post http://localhost:8080/vuset $body ]
puts $res

puts "Testing vucreate"
set res [ rest::post http://localhost:8080/vucreate "" ]
puts $res

puts "Testing vucreate"
set res [ rest::post http://localhost:8080/vucreate "" ]
puts $res

puts "VU Status after create"
set res [rest::get http://localhost:8080/vustatus "" ]
puts $res

puts "Testing vudestroy"
set res [ rest::post http://localhost:8080/vudestroy "" ]
puts $res

puts "VU Status after destroy"
set res [rest::get http://localhost:8080/vustatus "" ]
puts $res

Running this script shows the following output.

$ ./restchk.tcl 
TEST DIRECT PRINT COMMANDS
--------------------------------------------------------
Printing output for db and converting JSON to text
JSON format
{
"ora": "Oracle",
"mssqls": "MSSQLServer",
"db2": "Db2",
"mysql": "MySQL",
"pg": "PostgreSQL",
"redis": "Redis"
}
TEXT format
ora Oracle mssqls MSSQLServer db2 Db2 mysql MySQL pg PostgreSQL redis Redis
Printing output for bm and converting JSON to text
JSON format
{"benchmark": "TPC-C"}
TEXT format
benchmark TPC-C
Printing output for dict and converting JSON to text
JSON format
{
"connection": {
"system_user": "system",
"system_password": "manager",
"instance": "oracle",
"rac": "0"
},
"tpcc": {
"count_ware": "1",
"num_vu": "1",
"tpcc_user": "tpcc",
"tpcc_pass": "tpcc",
"tpcc_def_tab": "tpcctab",
"tpcc_ol_tab": "tpcctab",
"tpcc_def_temp": "temp",
"partition": "false",
"hash_clusters": "false",
"tpcc_tt_compat": "false",
"total_iterations": "1000000",
"raiseerror": "false",
"keyandthink": "false",
"checkpoint": "false",
"ora_driver": "test",
"rampup": "2",
"duration": "5",
"allwarehouse": "false",
"timeprofile": "false"
}
}
TEXT format
connection {system_user system system_password manager instance oracle rac 0} tpcc {count_ware 1 num_vu 1 tpcc_user tpcc tpcc_pass tpcc tpcc_def_tab tpcctab tpcc_ol_tab tpcctab tpcc_def_temp temp partition false hash_clusters false tpcc_tt_compat false total_iterations 1000000 raiseerror false keyandthink false checkpoint false ora_driver test rampup 2 duration 5 allwarehouse false timeprofile false}
Printing output for script and converting JSON to text
JSON format
{"error": {"message": "No Script loaded: load with loadscript"}}
TEXT format
error {message {No Script loaded: load with loadscript}}
Printing output for vuconf and converting JSON to text
JSON format
{
"Virtual Users": "1",
"User Delay(ms)": "500",
"Repeat Delay(ms)": "500",
"Iterations": "1",
"Show Output": "1",
"Log Output": "0",
"Unique Log Name": "0",
"No Log Buffer": "0",
"Log Timestamps": "0"
}
TEXT format
{Virtual Users} 1 {User Delay(ms)} 500 {Repeat Delay(ms)} 500 Iterations 1 {Show Output} 1 {Log Output} 0 {Unique Log Name} 0 {No Log Buffer} 0 {Log Timestamps} 0
Printing output for vucreated and converting JSON to text
JSON format
{"Virtual Users created": "0"}
TEXT format
{Virtual Users created} 0
Printing output for vustatus and converting JSON to text
JSON format
{"Virtual User status": "No Virtual Users found"}
TEXT format
{Virtual User status} {No Virtual Users found}
Printing output for datagen and converting JSON to text
JSON format
{
"schema": "TPC-C",
"database": "Oracle",
"warehouses": "1",
"vu": "1",
"directory": "\/tmp\""
}
TEXT format
schema TPC-C database Oracle warehouses 1 vu 1 directory /tmp\"
--------------------------------------------------------
PRINT COMMANDS COMPLETE
--------------------------------------------------------
TEST PRINT COMMANDS AS OPTION TO PRINT ie print?dict
Printing output for db and converting JSON to text
JSON format
{
"ora": "Oracle",
"mssqls": "MSSQLServer",
"db2": "Db2",
"mysql": "MySQL",
"pg": "PostgreSQL",
"redis": "Redis"
}
TEXT format
ora Oracle mssqls MSSQLServer db2 Db2 mysql MySQL pg PostgreSQL redis Redis
Printing output for bm and converting JSON to text
JSON format
{"benchmark": "TPC-C"}
TEXT format
benchmark TPC-C
Printing output for dict and converting JSON to text
JSON format
{
"connection": {
"system_user": "system",
"system_password": "manager",
"instance": "oracle",
"rac": "0"
},
"tpcc": {
"count_ware": "1",
"num_vu": "1",
"tpcc_user": "tpcc",
"tpcc_pass": "tpcc",
"tpcc_def_tab": "tpcctab",
"tpcc_ol_tab": "tpcctab",
"tpcc_def_temp": "temp",
"partition": "false",
"hash_clusters": "false",
"tpcc_tt_compat": "false",
"total_iterations": "1000000",
"raiseerror": "false",
"keyandthink": "false",
"checkpoint": "false",
"ora_driver": "test",
"rampup": "2",
"duration": "5",
"allwarehouse": "false",
"timeprofile": "false"
}
}
TEXT format
connection {system_user system system_password manager instance oracle rac 0} tpcc {count_ware 1 num_vu 1 tpcc_user tpcc tpcc_pass tpcc tpcc_def_tab tpcctab tpcc_ol_tab tpcctab tpcc_def_temp temp partition false hash_clusters false tpcc_tt_compat false total_iterations 1000000 raiseerror false keyandthink false checkpoint false ora_driver test rampup 2 duration 5 allwarehouse false timeprofile false}
Printing output for script and converting JSON to text
JSON format
{"error": {"message": "No Script loaded: load with loadscript"}}
TEXT format
error {message {No Script loaded: load with loadscript}}
Printing output for vuconf and converting JSON to text
JSON format
{
"Virtual Users": "1",
"User Delay(ms)": "500",
"Repeat Delay(ms)": "500",
"Iterations": "1",
"Show Output": "1",
"Log Output": "0",
"Unique Log Name": "0",
"No Log Buffer": "0",
"Log Timestamps": "0"
}
TEXT format
{Virtual Users} 1 {User Delay(ms)} 500 {Repeat Delay(ms)} 500 Iterations 1 {Show Output} 1 {Log Output} 0 {Unique Log Name} 0 {No Log Buffer} 0 {Log Timestamps} 0
Printing output for vucreated and converting JSON to text
JSON format
{"Virtual Users created": "0"}
TEXT format
{Virtual Users created} 0
Printing output for vustatus and converting JSON to text
JSON format
{"Virtual User status": "No Virtual Users found"}
TEXT format
{Virtual User status} {No Virtual Users found}
Printing output for datagen and converting JSON to text
JSON format
{
"schema": "TPC-C",
"database": "Oracle",
"warehouses": "1",
"vu": "1",
"directory": "\/tmp\""
}
TEXT format
schema TPC-C database Oracle warehouses 1 vu 1 directory /tmp\"
PRINT COMMANDS COMPLETE
--------------------------------------------------------
TEST DISET
Setting Warehouse Count to 800
Setting password to new password
Setting password error 1 invalid string
{"error": {"message": "Not a valid JSON string: '{ \"dict\": \"tpcc\", \"ke }'"}}
Setting password error 2 invalid number of arguments
{"error": {"message": "Incorrect number of parameters to diset dict key value"}}
Setting password error 3 invalid key
{"error": {"message": "Dictionary \"tpcc\" for Oracle exists but key \"tpcds_pass\" doesn't"}}
Setting password error 4 invalid string
{"error": {"message": "Dictionary \"tpcfg\" for Oracle does not exist"}}
Setting Driver Script
{"success": {"message": "Set driver script to timed, clearing Script, reload script to activate new setting"}}
Setting Driver Script Error
{"error": {"message": "Error: Driver script must be either \"test\" or \"timed\""}}
Clearscript
{"success": {"message": "Script cleared"}}
Loadscript
{"success": {"message": "script loaded"}}
Script in TEXT format
VU Status
{"Virtual User status": "No Virtual Users found"}
Testing dbset
{"error": {"message": "Unknown prefix mssqs, choose one from ora mssqls db2 mysql pg redis"}}
Testing dbset
{"error": {"message": "Invalid option to dbset key value"}}
Testing dbset
{"success": {"message": "Database set to PostgreSQL"}}
Testing dbset
{"error": {"message": "Unknown benchmark TPC-X, choose one from TPC-C TPC-H"}}
Testing dbset
{"success": {"message": "Benchmark set to TPC-H for PostgreSQL"}}
Testing vuset
{"error": {"message": "Invalid option to vuset key value"}}
Testing vuset
{"success": {"message": "Virtual users set to 10"}}
Testing dgset
{"success": {"message": "Set directory to \/tmp for data generation"}}
Testing Custom Script : Open File convert to JSON and post
{"success": {"message": "Set custom script"}}
Custom Script in TEXT format
Testing vuset
{"success": {"message": "Virtual users set to 5"}}
Testing vucreate
{"success": {"message": "6 Virtual Users Created with Monitor VU"}}
Testing vucreate
{"error": {"message": "Virtual Users exist, destroy with vudestroy before creating"}}
VU Status after create
{"Virtual User status": "1 {WAIT IDLE} 2 {WAIT IDLE} 3 {WAIT IDLE} 4 {WAIT IDLE} 5 {WAIT IDLE} 6 {WAIT IDLE}"}
Testing vudestroy
{"success": {"message": "vudestroy success"}}
VU Status after destroy
{"Virtual User status": "No Virtual Users found"}

When the environment is configured you can build schemas and run workloads with the same commands used for the CLI, for example:

set res [rest::post http://localhost:8080/buildschema "" ]
set res [rest::post http://localhost:8080/vurun "" ]

The key difference is that output is now stored in a job format that can be retrieved at a later point. An example is shown where a build generates a jobid.

{"success": {"message": "Building 5 Warehouses with 6 Virtual Users, 5 active + 1 Monitor VU(dict value num_vu is set to 5): JOBID=5D23464E58D203E273738333"}}

That is then used to query the status of the build.
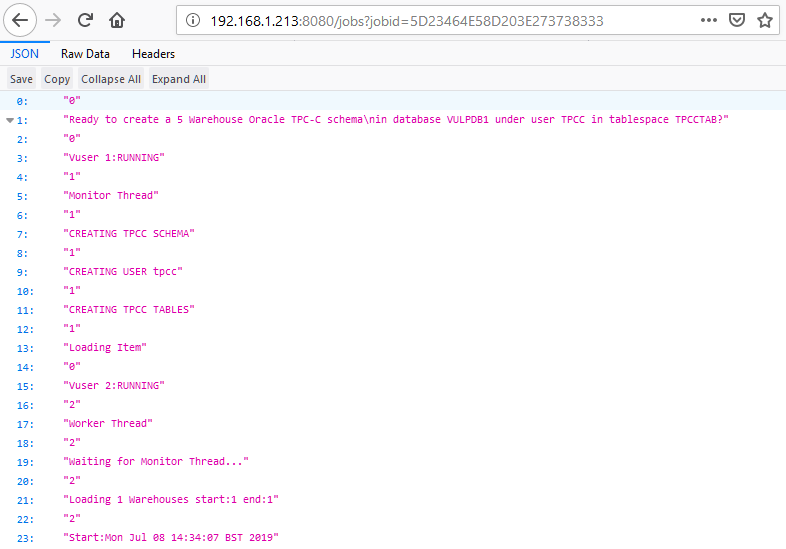
The output is stored in a SQLite database that by default runs in in-memory mode that is not persistent over restarts,  however it can be configured to use a permanent database.

It is not intended for the web service to replace the GUI or CLI environments that still prove the most popular way to run HammerDB, however the aim is to provide an additional way that HammerDB can be integrated into tests in  in cloud environments particular.

Running hammerdbcli from a bash or batch script updated for v3.2

By default the HammerDB command line interface was designed to run interactively. However many people wanted to run it from a script and an example to do this was shown here. However this only worked on Linux and therefore @xychar proposed a modification to run command line scripts directly instead of typing commands by hand for Windows, as using pipe for standard input does not work on Windows.

Reviewing the proposed change it was clear that doing the same thing as running an autopilot script in the GUI could be adapted for use with the CLI and therefore from version 3.2 it is possible to add the auto keyword and the same of a script to run it non-interactively, for example hammerdbcli auto script_to_run.tcl  on Linux or hammerdbcli.bat auto script_to_run.tcl on Windows.

An example script is shown to build a schema called buildcli.tcl. Note that the line “vwait forever” has been added so that the interpreter enters the event loop that happens automatically in interactive mode.

!/bin/tclsh
puts "SETTING CONFIGURATION"
global complete
proc wait_to_complete {} {
global complete
set complete [vucomplete]
if {!$complete} { after 5000 wait_to_complete } else { exit }
}
dbset db ora
diset connection system_password oracle
diset connection instance vulpdb1
diset tpcc count_ware 2
diset tpcc num_vu 2
diset tpcc tpcc_def_tab users
print dict
buildschema
wait_to_complete
vwait forever

This can then be called as follows from a driving script. The auto keyword then makes hammerdbcli enter a non-interactive mode to run the specified script.

$ more build.sh
#!/bin/bash
echo "BASH SCRIPT BEFORE BUILD.."
./hammerdbcli auto buildcli.tcl
echo "BASH SCRIPT AFTER BUILD.."

When run the output looks as follows:

./build.sh
BASH SCRIPT BEFORE BUILD..
HammerDB CLI v3.2
Copyright (C) 2003-2019 Steve Shaw
Type "help" for a list of commands
The xml is well-formed, applying configuration
SETTING CONFIGURATION
Database set to Oracle
...
Vuser 2:FINISHED SUCCESS
Vuser 1:Workers: 0 Active 2 Done
Vuser 1:CREATING TPCC INDEXES
Vuser 1:CREATING TPCC STORED PROCEDURES
Vuser 1:GATHERING SCHEMA STATISTICS
Vuser 1:TPCC SCHEMA COMPLETE
Vuser 1:FINISHED SUCCESS
ALL VIRTUAL USERS COMPLETE
BASH SCRIPT AFTER BUILD..

As per the original intention this can also be driven from a Windows batch script for automation.

HammerDB Source Code moved to the TPC Council

The TPC Council recently announced that the TPC is now hosting the HammerDB open source projects GitHub repository.

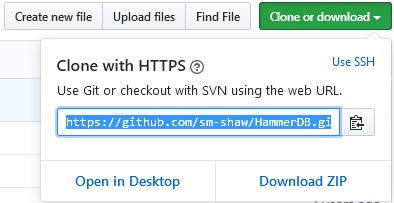
HammerDB has increased dramatically in popularity and use and has been identified as  the industry default for database benchmarking illustrating both the popularity of open source  and TPC based benchmarks.  Consequently with the wish to engage with the open source database benchmarking community the TPC approached HammerDB to collaborate on development and bring together both the communities around the TPC benchmarks and HammerDB.  The first step towards this goal is the recently announced move of the HammerDB source code to the TPC-Council GitHub repository.  The previous developer owned GitHub repository sm-shaw github repository has been deleted and the TPC-Council repository will be the source code repository for ongoing and future HammerDB development.  Anyone wishing to contribute to the development of HammerDB should do so from the HammerDB TPC-Council GitHub repository. From the first release up to version 3.1 HammerDB has been released on the HammerDB sourceforge site and currently hosts the runnable binary downloads and support site. Over time downloads and support will also transition to the TPC-Council GitHub site.  The HammerDB website hosts the latest documentation in docbook format and links to published benchmarks and will be maintained as the primary website.  Downloads from the download page on this site will show the current release.  To understand the difference between the downloadable binaries and the source code view the post on HammerDB Concepts and Architecture.

The license of HammerDB remains as GPLv3 and copyright to Steve Shaw the developer of HammerDB. For additional clarity Steve Shaw is an employee of Intel however HammerDB is not Intel software and was developed as an approved personal open source project where a stipulation of this approval was that there would be no association of the software with Intel or the developers status as an employee of the company.

Testing MySQL 8.0.16 on Skylake with innodb_spin_wait_pause_multiplier

In the recent MySQL 8.0.16 release there is a new variable for the InnoDB storage engine called innodb_spin_wait_pause_multiplier described as providing “greater control over the duration of spin-lock polling delays that occur when a thread waits to acquire a mutex or rw-lock” and “delays can be tuned more finely to account for differences in PAUSE instruction duration on different processor architectures”

This post aims to address what this about and whether you really need to be concerned about the difference in instructions on the different processor architectures for MySQL  by testing the performance with HammerDB.  Note that the main developer of HammerDB is Intel employee (#IAMINTEL) however HammerDB is a personal open source project and HammerDB has no optimization whatsoever for a database running on any particular architecture.  Fortunately the HammerDB TPC-C/OLTP workload intentionally has a great deal of contention between threads and is therefore ideal for testing spin-locks.

So the PAUSE instruction is  an optimization over NOP when a thread is waiting to acquire a lock and is particularly important in spin-locks on x86 CPUs for power and performance. However in the Skylake microarchitecture (you can see a list of CPUs here) the PAUSE instruction changed and in the documentation it says “the latency of the PAUSE instruction in prior generation microarchitectures is about 10 cycles, whereas in Skylake microarchitecture it has been extended to as many as 140 cycles.” and “as the PAUSE latency has been increased significantly, workloads that are sensitive to PAUSE latency will suffer some performance loss.”  The impact on a database workload is not necessarily straightforward however as it depends on how much time that workload actually spends in spin-locks, fortunately as noted a HammerDB deliberately induces a great deal of contention so is at the top end of workloads that do.

Also it is interesting to note that the impact of this change was not observed in other databases or other MySQL storage engines such as MyRocks the only noticeable impact with HammerDB workloads occurred in MySQL  with InnoDB where in the source code ut0ut.cc in the directory storage/innobase/ut the following section has UT_RELAX_CPU defined to call the PAUSE instruction on x86.

for (i = 0; i <delay * 50; i++) {
    j += i;  
      UT_RELAX_CPU();
  }

Note that this fixed value of 50 is multiplied by the parameter  innodb_spin_wait_delay which has a default of 6 (but selects a value at random up to this value) so could be calling PAUSE up to 300 times. So innodb_spin_wait_delay has always been configurable in recent versions but now from MySQL innodb_spin_wait_pause_multiplier is configurable also rather than requiring modification of the source code to do so.   However as noted many factors affect spin-locks including how much time you actually spend in locks in the first place and therefore the best way to really determine how much time you have to spend in fine-tuning spin-locks in  the real world can be done through testing.

So to test I took a system with Skylake CPUs and all storage on a P4800X SSD.

model name : Intel(R) Xeon(R) Platinum 8180 CPU @ 2.50GHz

The OS was:

 Ubuntu 18.04.1 LTS (GNU/Linux 4.15.0-23-generic x86_64)

I downloaded and installed the pre-built Linux binary from here:

mysql-8.0.16-linux-glibc2.12-x86_64

and set the following my.cnf

[mysqld]
datadir=/home/mysql/mysql-8.0.16/mysql-8.0.16-linux-glibc2.12-x86_64/data
language=/home/mysql/mysql-8.0.16/mysql-8.0.16-linux-glibc2.12-x86_64/share/english
default_authentication_plugin=mysql_native_password
socket=/tmp/mysql.sock
port=3307
bind_address=127.0.0.1
# general
 max_connections=4000	
 table_open_cache=8000
 table_open_cache_instances=16
 back_log=1500
 default_password_lifetime=0
 ssl=0
 performance_schema=OFF
 max_prepared_stmt_count=128000
 skip_log_bin=1
 character_set_server=latin1
 collation_server=latin1_swedish_ci
 transaction_isolation=REPEATABLE-READ

# files						
 innodb_file_per_table
 innodb_log_file_size=1024M
 innodb_log_files_in_group=32
 innodb_open_files=4000
						
# buffers
 innodb_buffer_pool_size=64000M
 innodb_buffer_pool_instances=16
 innodb_log_buffer_size=64M

# tune
 innodb_doublewrite=0
 innodb_thread_concurrency=0
 innodb_flush_log_at_trx_commit=0
 innodb_max_dirty_pages_pct=90
 innodb_max_dirty_pages_pct_lwm=10
						
 join_buffer_size=32K
 sort_buffer_size=32K
 innodb_use_native_aio=1
 innodb_stats_persistent=1
 innodb_spin_wait_delay=6
 innodb_spin_wait_pause_multiplier=50
						
 innodb_max_purge_lag_delay=300000
 innodb_max_purge_lag=0
 innodb_flush_method=O_DIRECT_NO_FSYNC
 innodb_checksum_algorithm=none
 innodb_io_capacity=4000
 innodb_io_capacity_max=20000
 innodb_lru_scan_depth=9000
 innodb_change_buffering=none
 innodb_read_only=0
 innodb_page_cleaners=4
 innodb_undo_log_truncate=off

# perf special
 innodb_adaptive_flushing=1	
 innodb_flush_neighbors=0
 innodb_read_io_threads=16
 innodb_write_io_threads=16
 innodb_purge_threads=4
 innodb_adaptive_hash_index=0

# monitoring						
 innodb_monitor_enable='%'

Initially I set doublewrite and flush_log_at_trx_commit and then deleted and rebuilt the schema to re-test with these parameters turned on.

I installed HammerDB 3.1 and used the client library from MySQL 5.7 installed in the home directory

libmysqlclient.so.20

and added this to the library path as follows:

export LD_LIBRARY_PATH=/home/mysql:$LD_LIBRARY_PATH

I created a HammerDB build file and called it using the source command with the hammerdbcli tool.

HammerDB-3.1$ cat innodbbuild400.tcl
#!/bin/tclsh
puts "SETTING CONFIGURATION"
dbset db mysql
diset connection mysql_host 127.0.0.1
diset connection mysql_port 3307
diset tpcc mysql_count_ware 400
diset tpcc mysql_partition true
diset tpcc mysql_num_vu 64
diset tpcc mysql_storage_engine innodb
print dict
buildschema

Once the schema was built I shutdown and restarted the database and configured a test script as follows:

HammerDB-3.1$ cat innodbtest1.tcl
#!/bin/tclsh
proc runtimer { seconds } {
set x 0
set timerstop 0
while {!$timerstop} {
incr x
after 1000
if { ![ expr {$x % 60} ] } {
set y [ expr $x / 60 ]
puts "Timer: $y minutes elapsed"
}
update
if { [ vucomplete ] || $x eq $seconds } { set timerstop 1 }
}
return
}
puts "SETTING CONFIGURATION"
dbset db mysql
diset connection mysql_host 127.0.0.1
diset connection mysql_port 3307
diset tpcc mysql_driver timed
diset tpcc mysql_rampup 1
diset tpcc mysql_duration 2
vuset logtotemp 1
loadscript
puts "SEQUENCE STARTED"
foreach z { 1 2 4 8 16 24 32 40 48 56 64 72 80 88} {
puts "$z VU TEST"
vuset vu $z
vucreate
vurun
runtimer 240
vudestroy
after 20000
}
puts "TEST SEQUENCE COMPLETE"

and then ran the test leaving it unattended until it reported the message “TEST SEQUENCE COMPLETE”. In particular note that the parameter innodb_spin_wait_pause_multiplier remained at the default throughout.

HammerDB-3.1$ ./hammerdbcli 
HammerDB CLI v3.1 
Copyright (C) 2003-2018 Steve Shaw 
Type "help" for a list of commands 
The xml is well-formed, applying configuration 
hammerdb>source innodbtest1.tcl

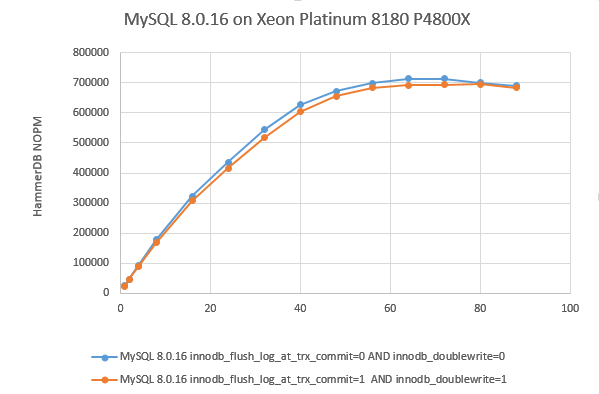
The following was the results in graph form:

with a peak performance of the following:

Vuser 1:64 Active Virtual Users configured 
Vuser 1:TEST RESULT : System achieved 2159378 MySQL TPM at 713488 NOPM

so we are generating more than 2 million MySQL Transactions per minute and more than 700,000 New Orders per minute without having modified any of the spin-loop parameters.

Now that the parameter is configurable I could also run some experiments:

mysql> show global variables like '%pause%'; 
+-----------------------------------+-------+ 
| Variable_name | Value | 
+-----------------------------------+-------+ 
| innodb_spin_wait_pause_multiplier | 50 | 
+-----------------------------------+-------+ 
1 row in set (0.00 sec) 

mysql> set global innodb_spin_wait_pause_multiplier=25; 
Query OK, 0 rows affected (0.00 sec) 

mysql> show global variables like '%pause%'; 
+-----------------------------------+-------+ 
| Variable_name | Value | 
+-----------------------------------+-------+ 
| innodb_spin_wait_pause_multiplier | 25 | 
+-----------------------------------+-------+ 
1 row in set (0.00 sec)

what I found was when reducing innodb_spin_wait_pause_multiplier signficantly to a value such as 5 I could achieve marginally improved performance up to 40 virtual users  643423 NOPM at a value of 5 compared to 626630 NOPM at 50 however beyond this point performance was signficantly lower and at 64 virtual users was only 278909 NOPM.   The optimal performance remained at the default.

Further testing involved doubling the number of warehouses with the same results, however not partitioning the schema did bring some benefits in reducing innodb_spin_wait_pause_multiplier to a lower value.

The key finding was remarkably consistent with that of spin-lock configuration on other databases in that in the vast majority of use cases you simply do not have to worry about modifying these parameters from the default regardless of the processor architecture. However it is noted that there are many factors that input into home much time is spent in spin-locks in the first place until these parameters come into play, examples such as the speed of the memory and the storage and configuration of the schema with partitioning as well as the operating system.  In particular the number of concurrent users is going to be a significant factor.

Nevertheless if you have an application generating millions of  transactions per minute and have the opportunity to test and optimize surely the availability of more parameters to fine tune a database to a particular application is welcome because with each release MySQL is continuing to push the boundaries of performance over previous releases.

The top 5 reasons to run your own database benchmarks

Some opinions claim that “Benchmarks are meaningless”, “benchmarks are irrelevant” or “benchmarks are nothing like your real applications”However for others “Benchmarks matter,” as they “account for the processing architecture and speed, memory, storage subsystems and the database engine.”

So who is right? Could you really be better off not being better informed? This post addresses some of the opinions around database benchmarking and gives the top 5 reasons why industry standard benchmarking is important and should be an essential foundation of your database engineering strategy.

Note that the main developer of HammerDB is Intel employee (#IAMINTEL) however HammerDB is a personal open source project and any opinions are specific to the context of HammerDB as an independent personal project and are not related to Intel in any way.

1. Repeatability

The first known usage of the term benchmark stems from surveying in the early 1800’s  to mark the border between North and South Carolina. in this context a bench is a mark in typically a stone structure to place a level staff to make sure that accurate measurements can be made from the same position at some point in time in the future.  This initial usage of the term gives us  insight into the importance of benchmarks today that can be summed in a single word  “Repeatability”.   Just like the original context of the term benchmark the single most important and overriding factor of any database benchmark is that if you run the same test on exactly the same configuration, (allowing for a small margin or error) you get the same result.  If you change something and re-run the same test the difference in the results can be attributed to the changes you made.  Consequently over time you have a reference point “set in stone” from which future changes can be measured by running the same test.  That is why we run a workload designed exactly for this purpose as it gives us a “benchmark”.

2. Scalability

Benchmarks are nothing like your real applications, and that’s actually good thing because unlike your application a good benchmark application like HammerDB has been designed to scale. “Scalability” is a product of both the benchmarking application itself (See the post on HammerDB Architecture to see how it scales implementing multiple virtual users as threads) as well as the benchmarking workload (The TPC benchmarks that HammerDB uses have been designed specifically for this purpose and proven over decades to scale). With a proven application and workload that delivers repeatability, you can then determine the capabilities of the components that you want to assess as noted in the introduction such as processing architecture and speed, memory, storage subsystems and the database engine.

For example the following chart (with the actual data removed for the reasons described further in this post) shows the HammerDB TPC-C workload run against the same database on different processing architectures (grouped by colour) and speed with the most recent at the top. As the chart shows because we know that both HammerDB and the implementation of the TPC-C workload scales then we can determine that with this particular database engine both the software and hardware scales as well.

If you only test your own application (and if you have more than one application which one will you use for benchmarking?) can you be sure that it scales?  if not how will you determine the optimal deployment platform for those applications (if you don’t know  whether your application  scales in the first place?) The answer is to run a proven application and workload to provide those quantifiable and repeatable results. With a chart such as the one above you can then compare results from your own application tests to determine whether they scale as well.

3. Security

So if you have compared the results of your own application and it is repeatable and scalable then why not use that for all of your benchmarking going forward? A key reason is  “Security” of the data that you are going to use to test for your benchmarks.  When running HammerDB you can generate and insert data “on the fly”  or generate flat files and upload them for bulk inserting. In all cases this is random data so presents no security challenges.  When testing your application however this is a very real consideration.  For example when considering moving a database application into the cloud are you going to copy your actual production data into multiple cloud environments for testing?  If not are you going to “clean” your data so it does not present a security risk? A benchmarking scenario of testing maintenance jobs is one of the highest risk approaches  around. If you are going to restore your production backups onto the new server how can you be sure that this data is safe in transit and completely deleted when the test is complete.  Either way there will be a much higher level of security due diligence and hence cost required when using production data.  Even if you are confident that your data is secure then  you then need a way to accurately simulate your application. HammerDB offers a way to do this for Oracle by the replaying of trace files and there is an excellent series on doing this by House of Brick. However be aware that even such an approach as capturing tracefiles or using similar tools can reveal the data in your application.

4. Portability

Even if you are not particularly concerned about the security of your data for your test strategy, then another disadvantage of only testing your own application is that it is likely to lack “Portability”.  This means that if you wish to compare your application running against a different database or operating system then there may be a considerable effort to port the application to multiple new environments just for testing and after establishing functionality there may be considerable tuning effort as well.  This is why for example HammerDB offers all functionality equally on both Windows and Linux and was therefore the first benchmarking tool to natively support SQL Server on Linux. HammerDB has been tuned, optimized and tested against all of the databases it supports for high performance to enable you to explore the boundaries of these databases before committing to a full porting strategy for your application.  in addition to restrictions on the portability of your own application this also applies to a number of available database benchmarking applications as well. HammerDB provides performance metrics that can be used to compare databases however many benchmarking tools are severely limited being available only on one operating system or supporting only one database. This lack of portability restricts the comparability of your available options at the outset making a non-portable benchmark set is of limited use.

5. Shareability

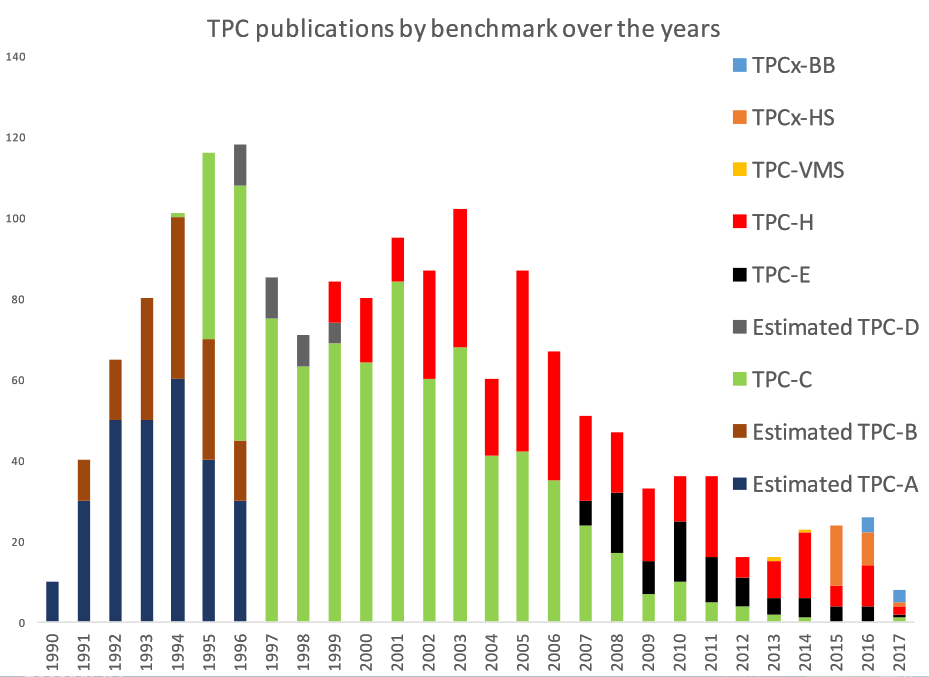
The final and arguably most important reason for running standard benchmarks is one of “Shareability”. There is a significant advantage in running the same repeatable, scalable,  secure and portable workload as everyone else with numerous examples shared on the HammerDB website.  For example if you want to run SQL Server on AWS there is already an example published by AWS here (Note how the graphs resemble the same scalability as previously described in this article). This is especially important as the number of official published benchmarks has reduced over time as shown in the graph from this presentation on TPC relevance.  The TPC workloads are more popular than ever before however the way are published and the information shared has changed dramatically in the era of cloud and social media.

The other side of shareability is the license clause known as the “Dewitt Clause” in some proprietary databases. There are many similar posts and articles on this clause which this post will not repeat apart from stating that database performance information may be less available for some databases compared to others as the license prevents the publication of performance data.  It is arguable that in the modern era whether these clauses continue to provide the benefit intended. Nevertheless the restriction of available data means running your own standard benchmarks to gather your own data for private is an essential process for users of these databases.

Summary

So are standard database benchmarks meaningless?  Clearly if the team running the benchmarks lacks the sufficient skillset to both correctly run and interpret the workloads then this could be true. Otherwise having a known workload that exercises all of the essential features of a relational database and runs on as varied an environment as possible is invaluable whether you are working in research or engineering and maybe even don’t have your own applications to test or are choosing the optimal hardware and software configurations for a complex production support environment.   Either way HammerDB is designed from the outset to help you be better informed and to share this performance information as widely as possible.

Why both TPM and NOPM Performance Metrics?

The reason for reporting both TPM and NOPM performance metrics is for both historical and performance reasons. On the historical side HammerDB started out as Hammerora and only supported Oracle so it only needed to report Oracle TPM. However as other databases were added they all record TPM in a slightly different way so it wasn’t possible to compare TPM between different database for example Oracle and SQL Server.  Therefore NOPM was added.

NOPM is a close relation of the official tpmC statistic recording only new orders per minute, however it is strictly forbidden to use the term tpmC unless you are doing an official fully audited and approved TPC-C benchmark and therefore the term NOPM signifies this difference.  Nevertheless because it comes from the schema itself that means that NOPM can be used to compare different databases whereas TPM cannot.

There should always be a close ratio between TPM and NOPM for example with Oracle NOPM is close to  1/3rd of TPM.  This also brings additional benefit that if the values diverge it may indicate errors in the testing. In particular because TPM records all transactions, both commits and rollbacks during the measuring period on the database whether HammerDB induced transactions or not.

Therefore one question is why not just use NOPM? There are 2 reasons. Firstly for database performance engineering studies TPM relates directly to the metrics captured from the database. For example  the TPM  value is the same number multiplied by 60 as the transactions per second value in the load profile of an Oracle AWR report (the SQL Statement actually gets the number from the AWR repository). Secondly and most importantly the TPM values for all databases are from in-memory tables again using the Oracle example v$sysstat (All v$ tables are memory based) and therefore selecting from these does not impact the test – this means we can then run the graphical transaction counter and select from this table without affecting the test results. However as NOPM is selected from the district table if we ran this during the test at the same frequency it would impact the results by introducing locking and therefore we take this value at the start and end of the test only.

Therefore this is why we have 2 values of TPM and NOPM and both are as valid as each other (graphs for TPM and NOPM should look identical) that can be summed up in a simple explanation. If you are comparing one database only then TPM is better as you can relate this directly to all of the database performance metrics you have captured however if you are comparing different databases then you should use NOPM instead when reporting results.

HammerDB Concepts and Architecture

HammerDB is open source and all of the source code is available at the sourceforge Git development site here https://sourceforge.net/p/hammerdb/code/ci/master/tree/ or the github mirror here https://github.com/sm-shaw/HammerDB.  This Git repository is updated with every release.  In fact all of this source code is also included in readable form with each and every release.  However if you have downloaded the source code and are looking to add features or make modifications such as adding new databases you may be wondering once you have the source code where to start. This guide to HammerDB concepts and architectures is aimed  at helping you understand how HammerDB is built and how it can be extended and modified.

Programming Languages

When you download the source code for HammerDB you can see that the programming language it is written in is called TCL .  TCL is a dynamic or interpreted language where the code is compiled into bytecode at runtime.  It is important to understand at the outset that HammerDB is written in TCL because of the unique threading capabilities that TCL brings. This article Threads Done Right… With Tcl gives an excellent overview of these capabilities and it should be clear that to build a scalable benchmarking tool this thread performance and scalability is key.  In contrast for example Python has the Global Interpreter Lock or GIL – “the global interpreter lock, or GIL, is a mutex that prevents multiple native threads from executing Python bytecodes at once. This lock is necessary mainly because CPython’s memory management is not thread-safe“. Therefore only TCL provides the foundation for building a tool such as HammerDB although Python can be loaded in the threads if desired.  If you are not familiar with TCL you can also see that it is closely associated with a graphical user interface toolkit called TK.  For HammerDB if you run the command-line version you are using TCL only, if you are running the graphical environment you are using TCL and TK. (Note that for the features used HammerDB will only run with TCL/TK 8.6 or above).  So if you have downloaded the source code or the pre-packaged version and look for example in files under the src directory you will see a number of files with a .tcl extension that you can read – these are identical in both the source code and the pre-packaged version.   It is of note that we have not discussed the operating system yet, that is because the source code and the code included with the pre-packaged versions is identical whether it is running on Linux or Windows on x86-64 architecture (or any other platform).  That is a slight exaggeration as there are some architectural differences (such as command-line console interaction) however these can be managed with a statement such as follows:

if {[string match windows $::tcl_platform(platform)]} {

Otherwise the code is the same on all platforms.  Clearly however there is a difference between platforms as you can tell from the download page and when you download the pre-packaged version you have and additional bin and lib directories that are (mostly) unique to a particular platform. These bin and lib directories are not included with the source code.  TCL was designed as a language to be closely tied with C/C++ and at this lower level there is the compiled TCL (tclsh) or TCL/TK (wish) interpreter and supporting libraries.  You can download and compile TCL/TK 8.6 or above yourself and replace the existing interpreter to be able to run the HammerDB interface from the source code by adding the bin and lib directories.  However HammerDB will not be able to connect to a database yet and the librarycheck command included with the CLI gives an indication why.

HammerDB CLI v3.1
Copyright (C) 2003-2018 Steve Shaw
Type "help" for a list of commands
The xml is well-formed, applying configuration
hammerdb>librarycheck
Checking database library for Oracle
Success ... loaded library Oratcl for Oracle
Checking database library for MSSQLServer
Success ... loaded library tclodbc for MSSQLServer
Checking database library for Db2
Success ... loaded library db2tcl for Db2
Checking database library for MySQL
Success ... loaded library mysqltcl for MySQL
Checking database library for PostgreSQL
Success ... loaded library Pgtcl for PostgreSQL
Checking database library for Redis
Success ... loaded library redis for Redis

hammerdb>

Database Extensions

Also written in C HammerDB includes the pre-compiled extensions to the native interfaces for the databases that HammerDB supports as well as other supporting packages for functions such as graphing. Some of these packages have been modified from the original open source packages to ensure the correct functionality for HammerDB. All extensions have been compiled with gcc on Linux and MSVC on Windows for the x86-64 platform and require the presence of the compatible database library at runtime. For commercial databases this third-party library is the only non-open source component of the stack.

Database Extension
Oracle/TimesTen Oratcl 4.6
MS SQL Server/Linux and Windows Debian patch version of TclODBC 2.5.1 updated to 2.5.2
IBM Db2 updated version of db2tclBelinksy to add bind variable support as version 2.0.0
MariaDB/MySQL/Amazon Aurora MySQLTcl version 3.052
PostgreSQL/Greenplum/Amazon Redshift PgTcl Pgtclng version 2.1.1
Redis In-built pure TCL client
Trafodion SQL on Hadoop (Deprecated in HammerDB v3.0 ) TDBC included with TCL

Other Extensions

Functionality Extension
Clearlooks GUI Theme for Linux (but can be used on Windows)
Expect Console functionality for command-line functionality on Linux
tWAPI TCL Windows API used for command-line and CPU agent functionality on Windows
tkblt BLT graphical package extension for metrics for both Linux and Windows

Pure Tcl Modules

In addition to compiled extensions there are also a number of TCL modules located in the modules directory, these extensions are similar to the packages in the lib directory however the main distinction is that almost all of these modules are written in TCL rather than compiled extensions written in C.  These modules may also call additional packages for example as shown below the ReadLine module calls either Expect or tWAPI depending on the platform.

package provide TclReadLine 1.2
#TclReadLine2 modified to use Expect on Linux and Twapi on Windows
if {[string match windows $::tcl_platform(platform)]} {
package require twapi
package require twapi_input
...
}
} else {
package require Expect

Loading Extensions and Modules

The key command for loading extensions and modules is “package require”, for example the following extract at the top of the Oracle driver script shows the loading of the compiled Oratcl package as well as the common functions module for the TPC-C workload.

#!/usr/local/bin/tclsh8.6
set library Oratcl ;# Oracle OCI Library
#LOAD LIBRARIES AND MODULES
if [catch {package require $library} message] { error "Failed to load $library - $message" }
if [catch {::tcl::tm::path add modules} ] { error "Failed to find modules directory" }
if [catch {package require tpcccommon} ] { error "Failed to load tpcc common functions" } else { namespace import tpcccommon::* }

It should be clear that HammerDB is easy to extend by adding a new package into the lib (compiled) or modules (Pure TCL) directories and an example of how this is done is shown with adding Python support. The include directory contains the platform specific C header files for this purpose.

Agent

The agent directory contains the agent code to be run on the system under test to gather the CPU utilisation information. On Linux this runs the mpstat command on Windows mpstat is provided by HammerDB.

Images

The images directory contains TCL files with the images used by HammerDB encoded in base64 format.

Config

The configuration for HammerDB is defined by a number of XML files in the config directory.  HammerDB is modular meaning that this configuration determines the files and directories to load from the src directory at runtime.  At the top level is the database.xml that determines the other database configurations to load. Note that the commands field in this file only determines which words to highlight in the graphical text editor rather than defining the commands themselves.

Starting HammerDB

When you start HammerDB GUI on Linux the hammerdb file is a bash script file that calls the Linux compiled wish (window shell) executable that then runs the TCL commands incorporated within that shell file. On Windows there is an external batch file that calls the Windows compiled wish and then runs TCL commands within the hammerdb file.  For the command line it is the TCL shell that is run rather than wish.  The hammerdb file acts as a loader that loads the modules, the icon images and the generic source, the XML based configuration is then loaded followed by the database specific components dependent on this configuration.  The GUI or command line interface is then started.  As virtual users are started the database specific packages and workload specific modules are loaded into the virtual user threads. The following diagram illustrates the process. Note that as the diagram illustrates most of the code is shared between both command-line and GUI implementations and what and how the virtual users run this code is identical, therefore both GUI and commmand-line produce identical results.

XML to Dict

As HammerDB is modular under the src directory is a generic directory for shared source and a directory for each of the databases that has the same name as the XML configuration file for that database in the config directory.  HammerDB reads the XML at startup and manages the parameters internally in a 2 level nested dict structure per database.   For example for MySQL the dict is shown and the retrieval of a single value.

HammerDB CLI v3.1
Copyright (C) 2003-2018 Steve Shaw
Type "help" for a list of commands
The xml is well-formed, applying configuration
hammerdb>puts $configmysql
connection {mysql_host 127.0.0.1 mysql_port 3306} tpcc {mysql_count_ware 1 mysql_num_vu 1 mysql_user root mysql_pass mysql mysql_dbase tpcc mysql_storage_engine innodb mysql_partition false mysql_total_iterations 1000000 mysql_raiseerror false mysql_keyandthink false mysql_driver test mysql_rampup 2 mysql_duration 5 mysql_allwarehouse false mysql_timeprofile false} tpch {mysql_scale_fact 1 mysql_tpch_user root mysql_tpch_pass mysql mysql_tpch_dbase tpch mysql_num_tpch_threads 1 mysql_tpch_storage_engine myisam mysql_total_querysets 1 mysql_raise_query_error false mysql_verbose false mysql_refresh_on false mysql_update_sets 1 mysql_trickle_refresh 1000 mysql_refresh_verbose false mysql_cloud_query false}

hammerdb>puts [ dict get $configmysql connection mysql_host ]
127.0.0.1

hammerdb>

As the options boxes in the GUI are filled out or values set at the command-line these values are stored and retrieved from these underlying dicts.  At the top level the database.xml file determines the database specific data is read and the GUI populated at runtime rather than being fixed. For example changing the description field in the database.xml file as follows:

<name>MySQL</name>
<description>MariaDB</description>
<prefix>mysql</prefix>
<library>mysqltcl</library>
<workloads>TPC-C TPC-H</workloads>
<commands>mysql::sel mysqluse mysqlescape mysqlsel mysqlnext mysqlseek mysqlmap mysqlexec mysqlclose mysqlinfo mysqlresult mysqlcol mysqlstate mysqlinsertid mysqlquery mysqlendquery mysqlbaseinfo mysqlping mysqlchangeuser mysqlreceive</commands>
</mysql>

Will then display as follows in the interface.

Also note that the library field allows another library interface to be modified and recompiled or multiple version of libraries used for different databases.

Once the XML configuration is loaded the database specific files are loaded according to a directory in the database name and file names determined by prefix and the following purpose.

hammerdb>print db
Database Oracle set.
To change do: dbset db prefix, one of:
Oracle = ora MSSQLServer = mssqls Db2 = db2 MySQL = mysql PostgreSQL = pg Redis = redis
hammerdb>
Extension Purpose
met Graphical metrics, currently only completed for Oracle
olap Analytic workloads, currently TPC-H related build and driver
oltp Transactional workloads, currently TPC-C related build and driver
opt Graphical options dialogs, takes values from database specific dict and allows modification and saving
otc Database specific online transaction counter

Therefore for example in the directory /src/db2 the file db2opt defines the options dialogs when the db2 database is selected to load and store the dict based values. Then when a schema build is selected or driver script loaded the scripts are populated with those values entered into the dialog.

Virtual Users

Virtual Users within HammerDB are operating system threads.  Each thread loads its own TCL interpreter and its own database interface packages.  If you have not read the article Threads Done Right… With Tcl then now is a good time to do so to understand why HammerDB is so scalable.  (Note that the metrics interface and transaction counter also run in threads).

For example on Windows drilling down on the process explorer shows that the threads are evenly allocated to a different preferred CPU thereby making the best possible utilisation of the resources available.  When the virtual users are run the threads are posted the script in the Script Editor in the GUI (or the loaded script for the command line). At its simplest the following is a Hello World! program in TCL.

#!/usr/local/bin/tclsh8.6
puts "Hello World!"

Load this into the script editor and run it (or for one virtual user use the “Test TCL Code” button and the Virtual User will receive and run the program.

Using the File -> Save dialog you can modify existing scripts and then save and reload them for later use.

Running the Build and Driver Scripts

For the schema build or timed tests each virtual user receives and runs an identical copy of the script however is able to do something different. Each virtual user or operating system can identify its own thread id and therefore can be tasked with running a different part of the workload accordingly. This is how multiple virtual users will load a different part of the schema or how the virtual user that monitors a workload is identified.  Also the threads can “talk to each other” and respond to user input such as pressing the stop button using thread shared variables.  Otherwise overheads are minimal each virtual user will run entirely independently without interference from other threads and without locking overhead.  Therefore running HammerDB on a multi-core and multi-threaded CPU is strongly recommended as you will be able to take advantage of that processing power.  Output from virtual users are displayed to the virtual user output window.  Note that operating system displays are not thread safe and cannot be updated by more than one thread at a time, therefore each virtual user sends its output to the master thread for display. Clearly a “Test Script” will not be able to generate the same level of throughput as a “Timed Script” for this reason. HammerDB also manages the virtual user status and reports any errors produced by the virtual users to the console.

Autopilot and Modes

In addition to direct interaction HammerDB also provides an autopilot feature to automate testing.  This feature to be used in conjunction with timed tests allows for multiple tests to be run consecutively unattended without manual interaction. The way this feature works is for a timer to run at the user specified interval and at this timer interval HammerDB will automatically press the buttons that manual interaction would do. From a conceptual standpoint it is important to understand this as autopilot actually presses the same buttons that a user would, the only difference is that this is on a timed basis. Therefore if you want an autopilot run to complete successfully ensure that the time interval is long enough for your test to complete. There is no autopilot feature in the command-line tool as it is easier to script this functionality with the command-line.

Typically HammerDB will run in Local Mode however this modes feature allows an instance of HammerDB to be created as a Master and then multiple Slave instances connected to HammerDB to be controlled by the Master through network communication. This feature has been designed for scenarios where the user wants to direct a workload specifically at multiple database instances in a cluster or in a virtualized environment.

Summary

It should now be clear that HammerDB is a simple and modular application yet extremely powerful and high performance because of the multi-threaded architecture and design. HammerDB is also highly extensible and extensions written in C can be added to support for example new databases (or existing extensions used). After this simply adding a new config file and adding these details to database.xml and creating a new directory under the src directory is all that is needed to add another database to HammerDB.  Similarly new workloads can be added by modifying existing files. HammerDB will then take care of running these workloads either graphically or at the command line.

Of the most importance however it should be clear that HammerDB is completely and entirely open source. TCL itself is open source, all of the database extensions are open source and the database libraries themselves with the exception of commerical databases are open-source as well.  Also clearly all of the HammerDB code is open-source and readable within each installation so if you desire you can inspect literally every line of code right from the TCL interpreter to the extensions and HammerDB if you wish to do so.  Therefore nothing is hidden and nothing is proprietary giving absolute confidence in the results that HammerDB produces.  You are also empowered to modify, add and contribute improvements. HammerDB really is all about making database performance open-source and demystifying the often hidden aspects of database benchmarking from workloads to results.

How to improve Redo, Transaction Log and WAL throughput for HammerDB benchmarks

If you are new to running Oracle, SQL Server, MySQL and PostgreSQL TPC-C workloads with HammerDB and have needed to investigate I/O performance the chances are that you have experienced waits on writing to the Redo, Transaction Log or WAL depending on the database you are testing. This post at an entry-level discusses the options you have to improve log throughput in your benchmark environment. 

Note that the parameters in this article do have the potential to cause data loss if implemented on your production database without full understanding so ensure that you have read this post in its entirety before applying the settings to your environment. 

Logging Waits

Firstly we’ll take a look at why these log waits are so important to database performance in an OLTP environment. The diagram below shows a much simplified way how the I/O in a typical relational database operates.

Before  the database is started your data should  be in a consistent state on disk. When the database is started a component of the in-memory database instance is the data buffer. As data is requested (depending on the type of read), data blocks will be fetched and stored in-memory in this buffer, show in-blue.  Over time your workload will modify this data, shown in-red, however these changed data blocks or pages are not written back to the data disk immediately. In fact a single block or page may be modified in-memory multiple times before it is eventually at some point in-time written back to the data disk. In contrast to many people’s understanding of a traditional database against an “in-memory” database it is likely that if the buffer is large enough most of the data you are operating on remains in-memory for the duration of a HammerDB OLTP test. Therefore you are likely to see a spike of reads at the start of the test (this is why there is ramp-up time) and then potentially depending on your configuration the data disk can be relatively quiet for the duration of the test while periodically seeing write activities related to checkpoints (which will be discussed later). 

However it should be clear that in the case of a failure such as a crash of the database all of the data in-memory would be lost.  Therefore you have the redo, transaction or write-ahead log recording all of the changes to the database. Typically we will see a constant stream of write activity to this disk with no (or minimal) read activity.  If there is a failure of the database, subsequently on startup this log will be used to recover the data on the data disk up to the point of the most recent transaction (or the chosen recovery point) i.e. replaying all of those changes in-memory that we lost. To recover right up to the most recent point those writes to the log needed to be synchronous i.e. when a transaction is committed the session waits until the database has confirmed that the changes have been recorded to the log before continuing work.  Note that this does not mean that the log is only written at the time of a commit, changes will be streamed into an in-memory log buffer and written to the log disk constantly however once a transaction is committed the user sessions will wait until this log write is confirmed. This wait by the session is what is typically seen as a log wait.  Bear in mind that writing to the log takes CPU, it will be a log writing thread or process that needs CPU time to be scheduled to be active,  it also requires memory for the log buffer and finally disk for the log itself, therefore this log wait is more than just the disk component. Additionally for the log disk component it is latency for an individual write that is crucial rather than the total I/O bandwidth.

As HammerDB supports graphical metrics for Oracle, this provides the best illustration however the concepts apply in general terms to all databases.

Oracle Log File Sync

The following example takes a snapshot of Oracle metrics showing 3 spikes of activity on a consumer level PC running Oracle within a Virtual Box VM for illustration purposes.The database has been created with the default redo log configuration which is 2 redo logs of 200MB in size each.  The first example shows a data load, the second a TPC-C based workload with 5 virtual users and the 2nd example with 10 virtual users.

What can be seen fairly quickly is that the dominant colour is orange and the majority of database time is spent on “log file sync”, waiting for these synchronous writes to the redo log. As the activity is increased with the 2nd run performance is not improved, instead the database is spending more time waiting for the redo log.

To illustrate the data reads on Oracle we can flush the buffer cache.

SQL> alter system flush buffer_cache;

System altered.

SQL>

Re-running the same workload we can now see some blue read activity of “db file sequential read” from index reads at the start of the test, Once our data is buffered this read activity is then diminished as the data in memory is sufficient to sustain the workload that is being run by the rate that it is constrained by “log file sync”.

In this scenario the total throughput is considerably lower than the full potential of the system., so what are  your options?

Making Logging asynchronous

Clearly the most obvious option is to upgrade your log disk I/O capabilities to be able to sustain writes at the level that the test can produce and if running on a production system, this (and investigating your log size and configuration such as using the right disk sector size is the way to go). However what if in a test environment you cannot upgrade the log I/O but want to move beyond the log bottleneck to be able to test other system components more fully.  Fortunately all of the database supported by HammerDB include an option to make the logging asynchronous. In other words we will put our changes in the log buffer, issue a commit but not wait until this is confirmed. Instead we will continue under the assumption that the log write eventually made it to disk.  in this scenario it is possible that in the event of a failure data can be lost but for testing purposes it means we can potentially drive much higher levels of throughput than our log disk can typically sustain, showing the system potential if there were a better performing log configuration. Note however that this is not a solution that will make all log related waits disappear. As noted logging also involves CPU and memory and you will still need to make sure all writes reach the disk, the difference is that you are not flushing to disk synchronously on each commit and therefore are aiming to improve throughput by removing this dependency.

Oracle commit_wait and commit_logging

for Oracle the key parameter is commit_wait. By setting this parameter to NOWAIT the session will not wait for the write to be complete, instead continuing its work once the write has been issued.  This can be complemented by the parameter commit_logging being set to BATCH which groups the individual writes to be written in larger writes. 

commit_logging BATCH
commit_wait NOWAIT

These parameters can be set as follows:

SQL> alter system set commit_logging='BATCH' scope=spfile;

System altered.

SQL> alter system set commit_wait='NOWAIT' scope=spfile;

System altered.

Having set these parameters and re-run the previous test it can be seen that the wait events are now very different. In particular log file sync as intended has reduced considerably and been replaced by “db file sequential read” as the top event. Why is this the case? Because we have removed the log sync bottleneck we have now increased the throughput and put emphasis on the amount of data in the buffer that is being read-in and written-out at a much greater rate. Consequently we now need to increase the buffer cache in size if we are to see more CPU activity.  A good example of how tuning is an iterative process.

Checkpoint not complete

in the previous diagram we can also see the wait event log file switch (checkpoint incomplete). Returning to the first illustration it was shown that data will be periodically written to disk, at a checkpoint all of the data on disk is up to date with the same point in the log.  In this example with the default log configuration of 2 redo logs the database is attempting to switch from one log to the other however the checkpoint operation flushing the data from memory to the data disk has not yet caught up with the previous log and to begin writing to it would overwrite changes on the redo log that correspond to this not yet written yet, consequently the database will wait until this operation has been completed.

2018-11-02T15:38:27.662098+00:00
Thread 1 advanced to log sequence 1402 (LGWR switch)
  Current log# 1 seq# 1402 mem# 0: /home/oracle/app/oracle/oradata/VULCDB1/onlinelog/o1_mf_1_fjj87ghr_.log
2018-11-02T15:39:25.628040+00:00
Thread 1 cannot allocate new log, sequence 1403
Checkpoint not complete
  Current log# 1 seq# 1402 mem# 0: /home/oracle/app/oracle/oradata/VULCDB1/onlinelog/o1_mf_1_fjj87ghr_.log
2018-11-02T15:39:29.360911+00:00
Thread 1 advanced to log sequence 1403 (LGWR switch)
  Current log# 2 seq# 1403 mem# 0: /home/oracle/app/oracle/oradata/VULCDB1/onlinelog/o1_mf_2_fjj87gjj_.log

As can be seen this has happened on a consumer PC configuration with the default redo configuration, therefore for higher throughput also ensure that you resize the logs accordingly.

SQL Server DELAYED_DURABILITY

For SQL Server the equivalent parameter for asynchronous logging is set as follows for the parameter DELAYED_DURABILITY

ALTER DATABASESET DELAYED_DURABILITY = { DISABLED | ALLOWED | FORCED } 

On the same test system it can be seen that without setting this parameter, Logging is shown as the top resource wait. 

After setting ALTER DATABASE TPCC SET DELAYED_DURABILITY = FORCED  it can be seen that the waits on logging are reduced.

MySQL

For MySQL the dependency is at the storage engine level and in this case for the InnoDB storage engine the parameter is self-explanatory.

innodb_flush_log_at_trx_commit=0
PostgreSQL

Similarly for PostgreSQL logging can be set by setting synchronous_commit to off.

synchronous_commit = off                # synchronization
Summary

This post aims to address what is the most common scenario for someone running HammerDB TPC-C OLTP workloads for the first time when seeing waits on logging disks and what parameters can be set in a test based environment to achieve more throughput and observe what performance potentially could be achieved without a log disk bottleneck. 

Driving hammerdbcli from a bash script

Update: There is considerably more efficient method of running HammerDB through a bash script described in a more recent post here:  Running hammerdbcli from a bash or batch script updated for v3.2 It is strongly recommended to move to this method described for v3.2 rather than the method described in this post which can have a greater overhead and a potential impact on performance imposed by bash.

A current FAQ is how to drive the command line hammerdbcli from an external bash script. This post gives an example of one way which this can be done.

For an example we will run a bash script that prints output and then runs hammerdbcli to build an Oracle schema before wating for this to finish and printing more output.  Firstly we need the hammerdbcli script.  Note that as HammerDB is multithreaded, adding exit to the end of a script will cause that script to terminate before virtual users are complete. This is unlikely to be the desired outcome. Therefore you need a function that will wait for the script to complete before issuing the exit. The important command here is vucomplete and you need to wait until the condition of this is “true”. An example of this is as follows:

#!/bin/tclsh
puts "SETTING CONFIGURATION"
global complete
proc wait_to_complete {} {
global complete
set complete [vucomplete]
if {!$complete} {after 5000 wait_to_complete} else { exit }
}
dbset db ora
diset connection system_password oracle
diset connection instance vulpdb1 
diset tpcc count_ware 4
diset tpcc num_vu 4
diset tpcc tpcc_def_tab users
print dict
buildschema
wait_to_complete

This script has been saved as buildora.tcl.  Now we want the driving bash script that looks as follows:

#!/bin/bash
echo "BASH SCRIPT BEFORE BUILD.."
./hammerdbcli <<!
source buildora.tcl
!
echo "BASH SCRIPT AFTER BUILD.."

if you want to redirect your output to a file it can look like the following:

#!/bin/bash
echo "BASH SCRIPT BEFORE BUILD.."
./hammerdbcli <<!>> buildora.output 2>&1
source buildora.tcl
!
echo "BASH SCRIPT AFTER BUILD.."

If you run the bash script it will now call hammerdbcli that will run buildora.tcl, this will wait until complete to call exit before returning control back to the bash script. This is just one example of many ways in which hammerdbcli can be blended with Tcl, bash or even Python to automate HammerDB functionality.

If it is needed to strip the control characters from the output this can be done using sed. The stdbuf command can also be used to write the output line by line to the output file.

#!/bin/bash
echo "BASH SCRIPT BEFORE BUILD.."
./hammerdbcli <<! 2>&1 | stdbuf -oL -eL sed -e "s,\x1B\[[0-9;]*[a-zA-Z],,g" -e "s,\r,,g" -e "s,hammerdb>,,g" -e "s,after\#[0-9]*,,g" >> buildora.output
source buildora.tcl
!
echo "BASH SCRIPT AFTER BUILD.."