How to understand TPC-C tpmC and TPROC-C NOPM and what is ‘good’ performance?

More than ever, we see confusion in interpreting and comparing the performance of databases with workloads derived from the TPC-Council’s TPC-C specification, including HammerDB’s TPROC-C NOPM and TPM.

In this post, we revisit how to interpret transactional database performance metrics and give guidance on what levels of performance should be expected on up-to-date hardware and software in 2024.

tpmC

tpmC is the transactions per minute metric that is the measurement of the official TPC-C benchmark from the TPC-Council. To be more specific, tpmC measures the rate of New Order transactions only, executed per minute, while the database is also processing other transactions. Therefore, the tpmC is not the same as the number of total database transactions (i.e. transactions commits and rollbacks) recorded from the database metrics. This is an important concept, as different database engines may produce better performance with different ratios between tpmC and database transactions. Put simply, some database engines may perform better committing more frequently and some less so. Therefore, tpmC is the official metric and this is not the same as measuring database transactions.

Importantly, TPC-C and tpmC are registered trademarks of the TPC-Council. Without exception, TPC-C and tpmC can only be used for official audited TPC-C benchmarks published here by the TPC-Council. If a benchmark claiming a tpmC metric has not been audited and approved by the TPC-Council, then it is invalid as well as violating the registered trademarks of the TPC-C, only benchmarks found at the TPC-Council can use TPC-C and tpmC.

The TPC provide the specification for the TPC-C benchmark for free and workloads can be implemented derived from the specification, however it is not permitted to use the official terminology unless audited and HammerDB does not use the TPC-C and tpmC terminology to respect the TPC’s trademark.

NOPM and TPM/TPS

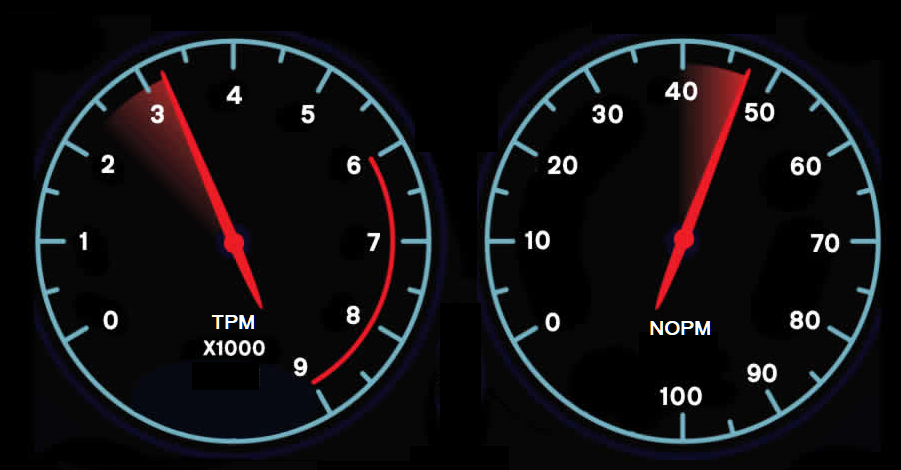
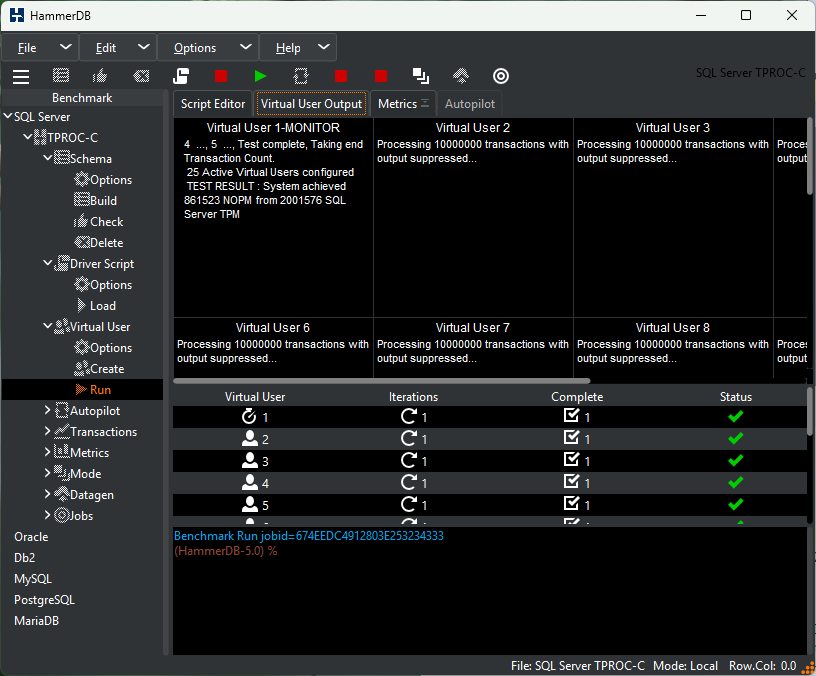
HammerDB implements a workload derived from the TPC-C specification called TPROC-C. HammerDB reports two metrics, NOPM and TPM.  The easiest way to understand NOPM and TPM is to think of the two metrics as the same you see on a dashboard. NOPM is how fast you are going, i.e. throughput, and TPM is how hard the engine is working to deliver that throughput.

The two metrics are relative, however, they are not the same.

NOPM

The HammerDB NOPM metric measures the rate of New Order transactions only, executed per minute, while the database is also processing other transactions. It therefore measures and reports the same metric as the official tpmC, however we are permitted to use tpmC for the reasons given in the section above. The NOPM value is the key measure of workload throughput.

TPM (TPS)

TPM is the metric derived from the database engine of the number of commits and rollbacks it is processing. This metric will relate to the transaction counter of database tools, for example Batches/sec in activity monitor for SQL Server Management studio. This metric allows you to relate database performance to the performance analysis of a specific database engine, however should not be compared between database engines. Where you see a similar TPS metric, simply multiply by 60 for a TPM equivalent. Note that we should typically expect TPM to be at least double that of NOPM and therefore be aware of comparing a TPM/TPS value from one workload with the NOPM value of another.

Fixed throughput workloads

Another concept to be familiar with, when comparing TPC-C derived workloads, is that of fixed throughput workloads and implementing keying and thinking time delays between transactions.  When using tpmC for an officially audited benchmark, this must be a fixed throughput workload, where each individual database session adds throughput so that the workload scales as we add more warehouses and users (and is another very good technical as well as legal reason not to use tpmC incorrectly). This type of approach can be implemented with HammerDB with the asynchronous scaling option as described in this post.

How to run a fixed throughput workload with HammerDB

However, with HammerDB at very early stages of development, it was identified that the performance ratio observed between systems was the same with both the HammerDB default workload without keying and thinking time as the official published TPC-C benchmarks with keying and thinking time.

Why this would be the case is straightforward. With an official TPC-C benchmarks there tends to be a TP Monitor or middleware between the clients and the server and therefore the clients are not connecting directly to the database. An official benchmark will not typically be implemented with thousands of connections to the database, instead the connections are managed by the middleware, as HammerDB does with asynchronous scaling where each Virtual User manages a much larger user defined number of connections. It is the middleware which maintains connections to the database, again typically in the low hundreds, that are driving high levels of throughput. This is why the default no key and think time approach produces similar scaling ratios to the official implementations.

Response Times

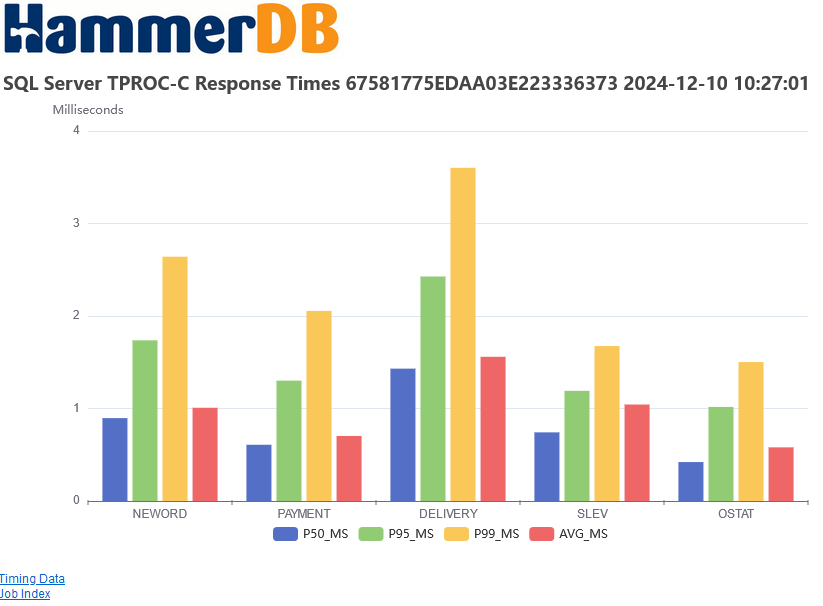
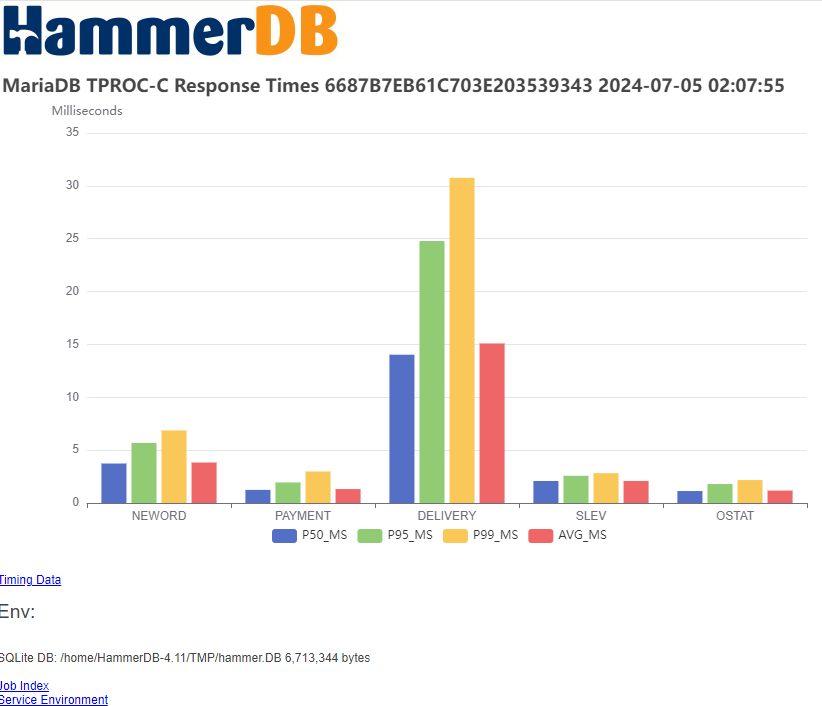
With HammerDB if you select the time profile checkbox it will record the response times of all the transactions. As shown below, using the HammerDB web service to view the results.  NEWORD is transaction that we are measuring for the NOPM metric.

Clearly, there is a relationship between response times and throughput.  For example, if we increase the number of virtual users and see performance at or lower than we saw at a lower number of virtual users, then the response times will be higher. For a ‘good’ level of throughput as we shall discuss in the next section our response should be in the low single-digit or tens of milliseconds. We should not expect response times to be in the region of hundreds or thousands of milliseconds (i.e. seconds).


What is ‘good’ performance?

Firstly, it is worth noting that database performance is relative.  With a high-performance database platform, you can do more with less to achieve the same results. However, there are trade-offs with, for example, uptime and reliability and for example a distributed database environment may provide lower performance results and higher response times but higher levels of availability.

Also, price/performance is an important, unless you have an unlimited budget you should always consider the Total Cost of Ownership (TCO) for a 3-year period of the system to gauge how much a particular level of performance will cost you.

Nevertheless, the key concept of database benchmarking is repeatability, if you set up exactly the same database configuration and run HammerDB against it, you should expect the same result. Any difference in performance can be attributed to the changes that you make.  Therefore, even when your testing environment is delivering throughput that far exceeds your expected production database performance, a test system that delivers better performance in a HammerDB test will also have the potential to outperform one for your real-world applications.

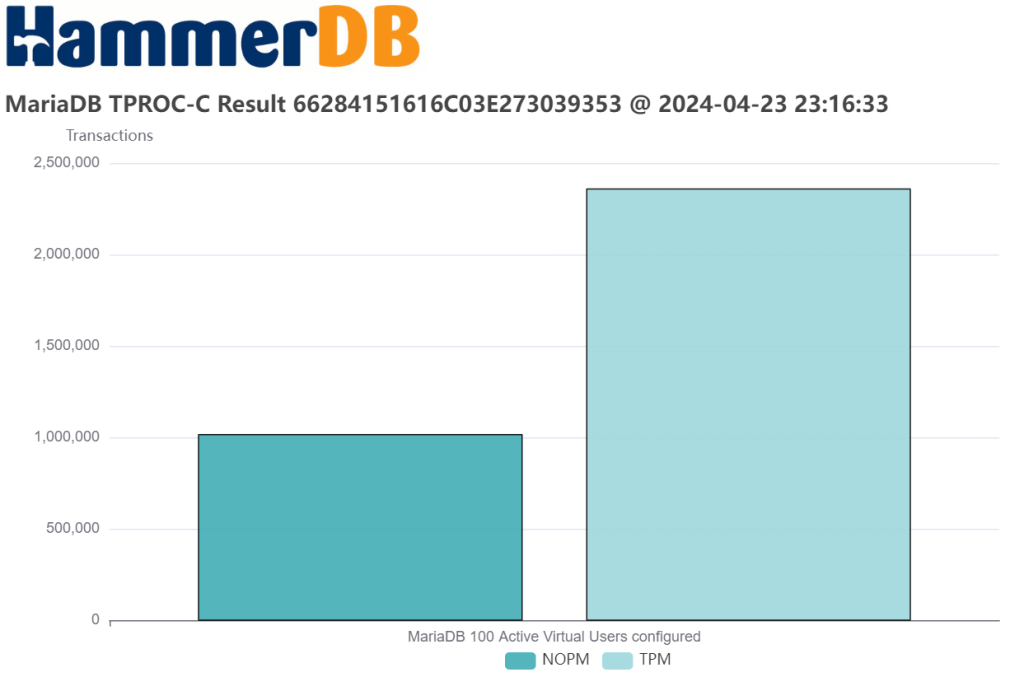
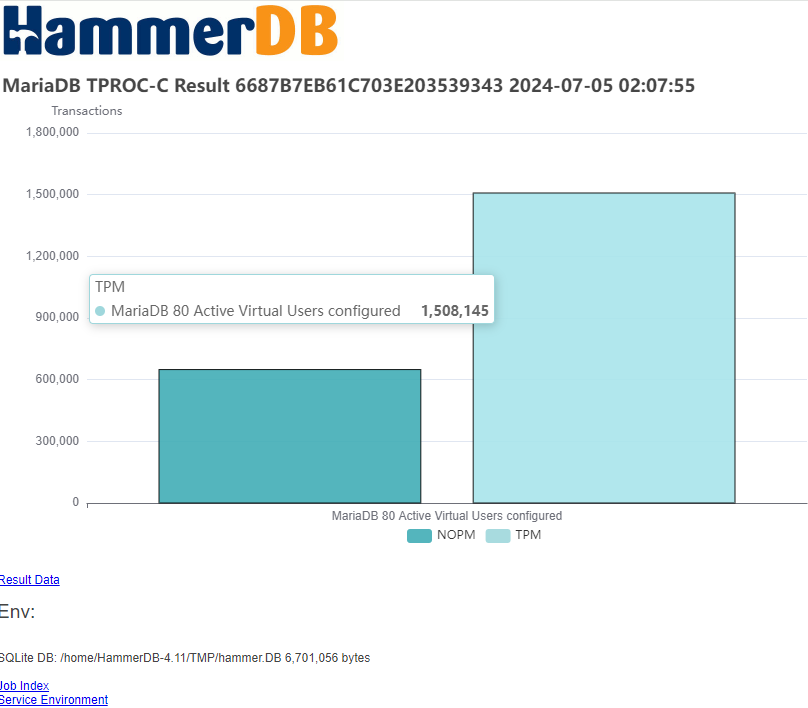
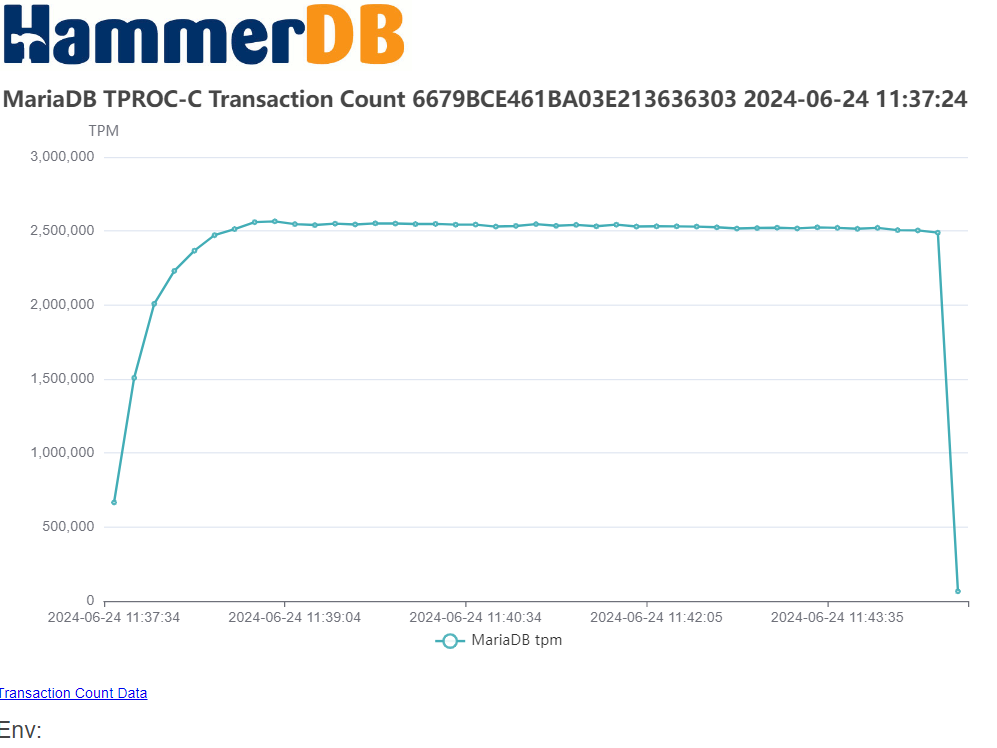
With these caveats, we can say that all the database engines that HammerDB supports can exceed 1M (1 million) NOPM for the HammerDB TPROC-C test, with the following example showing MariaDB.

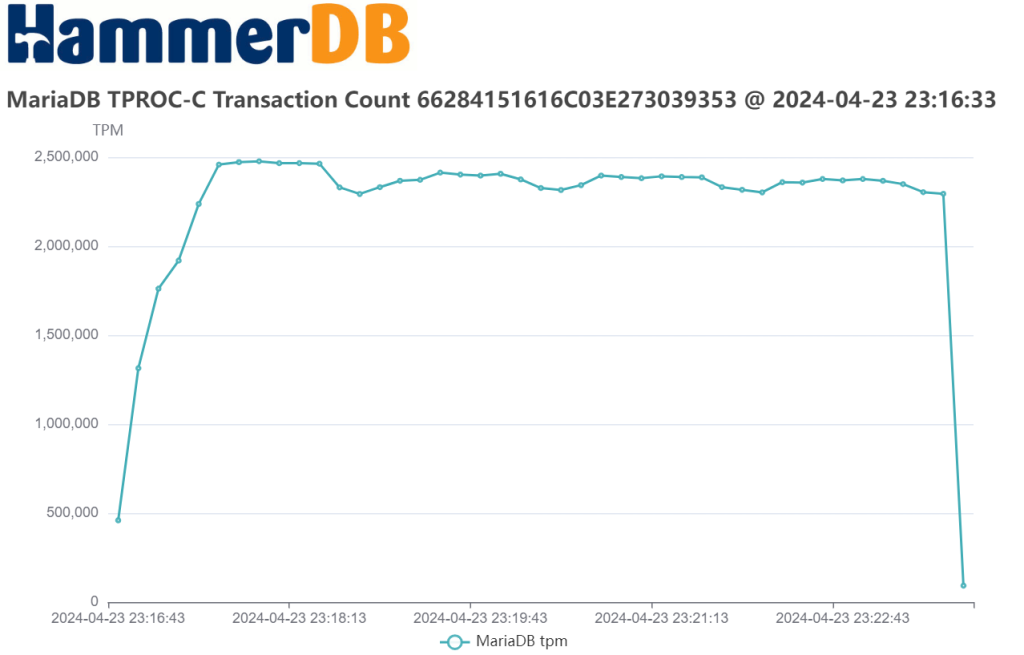
Also note as discussed that the database transaction rate exceeds 2M more than double the NOPM value as expected.

So, regardless of database engine, we have the potential to see HammerDB TPROC-C performance in the millions of NOPM and transactions. Of course, the exact figure that you see will depend on both hardware and software or more specifically for hardware – the CPU, memory, I/O and the ability of the engineer to configure and tune the hardware platform and for database software the ability of the engineer to configure and tune the database software and operating system (and virtualization layer), as well as to setup up run HammerDB. Results in the 10’s of millions are not uncommon with the most advanced hardware, software and expertise.

Summary

We have seen what metrics are important to a TPC-C derived test and how to interpret them.  We have also seen what constitutes ‘good’ performance on an up-to-date system.

As a final point, it is worth noting that the commercial database supported by HammerDB have been running the TPC-C workload that HammerDB is derived from for a long-time and a comparatively large amount of time and effort went into ensuring these databases ran the TPC-C workload very well. Unsurprisingly, this translates directly into HammerDB performance, and with the right hardware and engineer expertise the commercial databases will both perform and scale well and set the bar as would be expected.

Additionally, open source database performance is improving rapidly all the time, and we have seen open source databases more than double performance in HammerDB tests in recent years compared to earlier releases. Always consider the latest releases when evaluating the potential of open source database performance. The ability to compare and contrast the performance of different database engines rather than running test workloads entirely in isolation that only run against one database is crucial to this improvement.

There has never been a more important time to be running your own database benchmarks to continually evaluate the optimal database platform for your needs.


Diagnosing CPU faults and performance with HammerDB

An often overlooked aspect of database benchmarking is that it should be used to stress test databases on all new hardware environments before they enter production. In this post we will look at an example of issue diagnosis and resolution with the desktop CPU Intel® Core™ i9-14900K as well as examples of measuring database performance with both the performance and efficient cores with this CPU. We will look at some initial TPROC-C tests with SQL Server 2022 and Windows 11 with what we learned from the configuration.

APPCRASH and Diagnosis

To begin with, running in the default environment with a low number of Virtual Users works as expected, however as soon as we start to increase the number of Virtual Users, HammerDB crashes with an example error as below.

Faulting application name: wish90.exe, version: 9.0.2.0, time stamp: 0x6749d6f6
Faulting module name: tcl90.dll, version: 9.0.2.0, time stamp: 0x6749d49c
Exception code: 0xc0000005
Fault offset: 0x00000000001577ec
Faulting process id: 0x2510
Faulting application start time: 0x1DB44CF52D8545D
Faulting application path: E:\HammerDB-5.0-Win\HammerDB-5.0\bin\wish90.exe
Faulting module path: E:\HammerDB-5.0-Win\HammerDB-5.0\bin\tcl90.dll
Report Id: 364bd54e-7da0-4984-9d78-eb6c4ee343ea
Faulting package full name: 
Faulting package-relative application ID:

Looking in the Windows event logs we can see associated errors related to CPU instability.

A corrected hardware error has occurred.

Reported by component: Processor Core
Error Source: Corrected Machine Check
Error Type: Internal parity error
Processor APIC ID: 32

whilst every workload we run resulting in application crashes or BSOD with errors such as CLOCK_WATCHDOG_TIMEOUT, clearly highlighting a problem with our configuration.

Whereas a user might initially look to errors in the application as the cause of the issue, searching for the errors we see in the system logs leads us to the following link Vmin Shift Instability Root Cause specifically related to the Intel® Core™ i9-14900K with the resolution given as follows “For all Intel® Core™ 13th/14th Gen desktop processor users: the 0x12B microcode update must be loaded via BIOS update and has been distributed to system and motherboard manufacturers to incorporate into their BIOS.”

We have therefore diagnosed and resolved an issue with database performance through stress testing the platform with HammerDB.

Testing the Solution

Now we have updated the system BIOS with the 0x12B microcode update, the system or application no longer crashes and the schema build completes as expected.

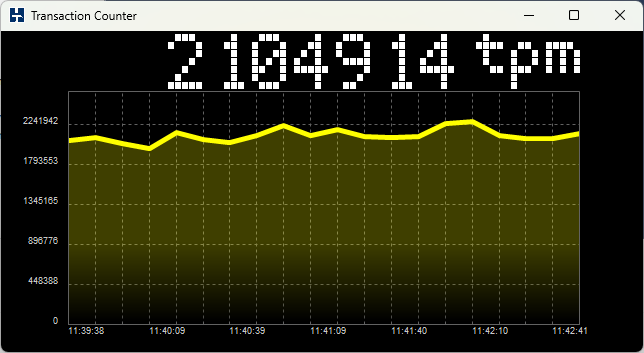
We can now run a test for a longer duration with the system exhibiting stability

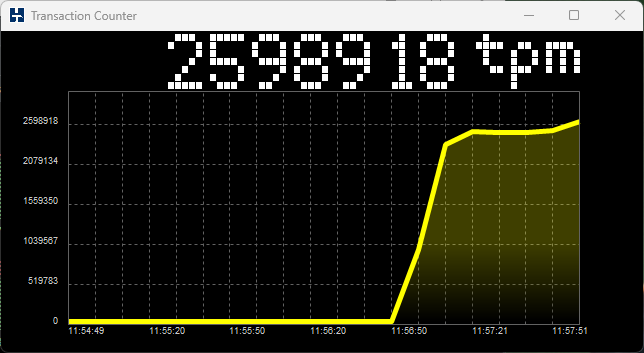
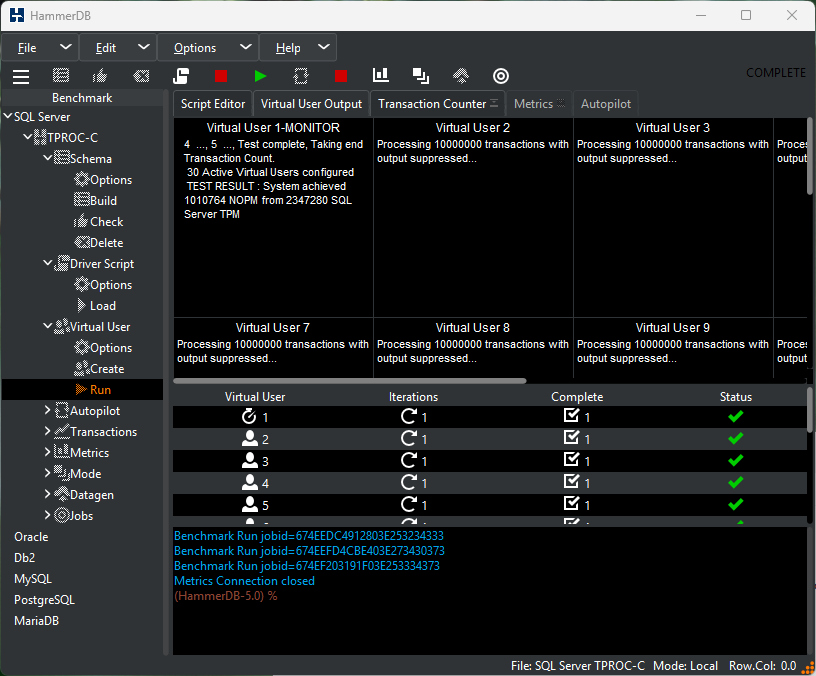
at 2M SQL Server TPM

and a highly respectable throughput of 800K+ NOPM for a desktop environment.

CPU affinity and calibration

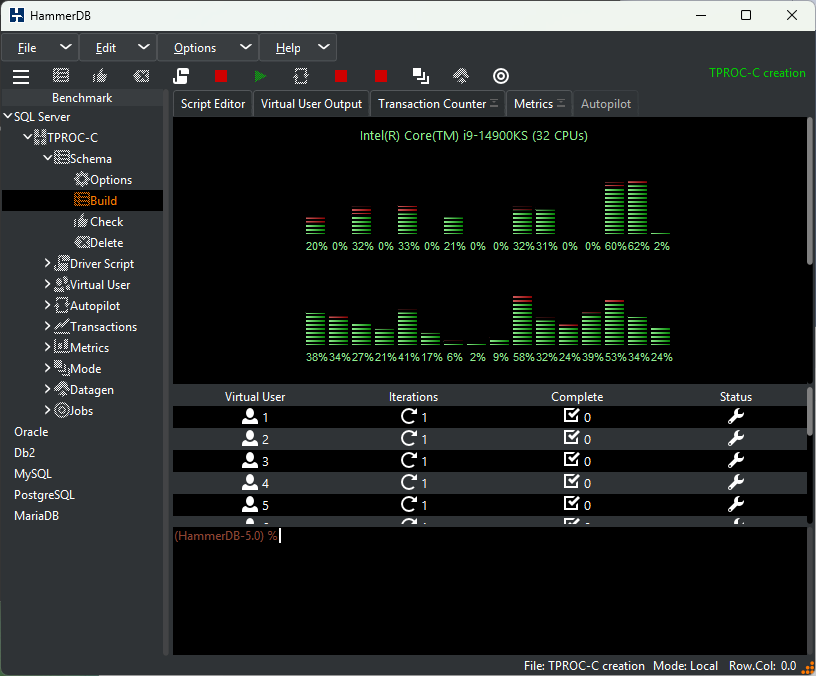
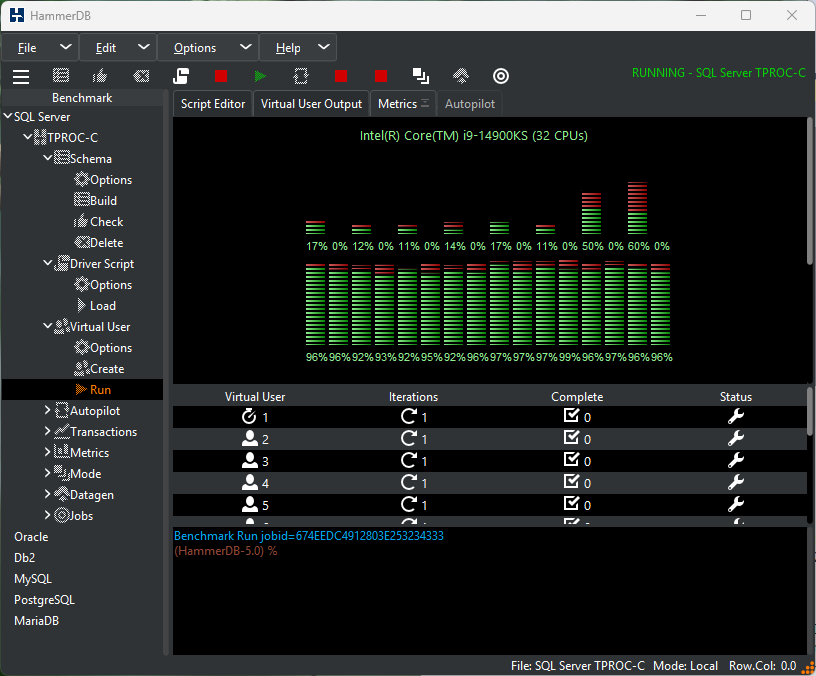
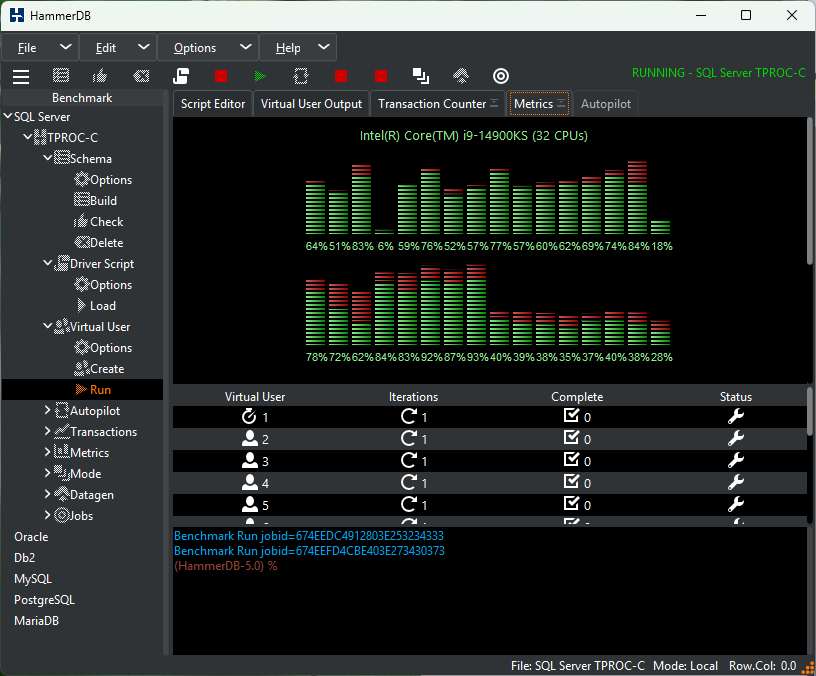
However we can see from the HammerDB CPU metrics that of the 32 logical CPUs available the first 16 cores appear to be underutilised during the test. (Another important CPU check is to identify individual cores with high levels of system utilisation, that could identify individual cores overburdened with interrupts). Additionally if we check the configuration of the i9-14900K we can see that there are 24 cores in this CPU of which 8 are performance cores,  16 efficient cores and hyper-threading  is only available on Performance-cores, therefore the first 16 logical CPUs on the system could be the 2 x logical CPUs of the performance cores.

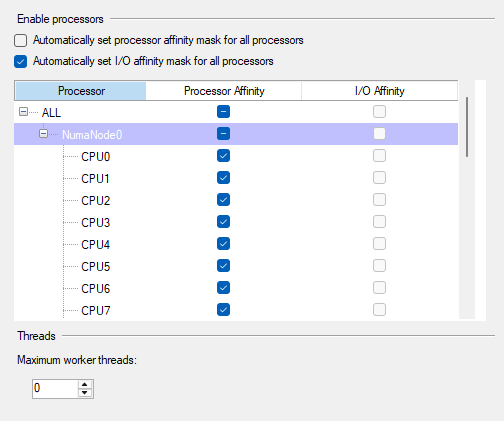
With SQL Server we can check this by manually setting the Processor Affinity

and using a single-threaded CPU test as described in the HammerDB documentation.

In this case we create and run the following routine on SQL Server

USE [tpcc]
GO
SET ANSI_NULLS ON
GO
CREATE PROCEDURE [dbo].[CPUSIMPLE] 
AS
   BEGIN
      DECLARE
         @n numeric(16,6) = 0,
         @a DATETIME,
         @b DATETIME
      DECLARE
         @f int
      SET @f = 1
      SET @a = CURRENT_TIMESTAMP
      WHILE @f <= 10000000 
         BEGIN
      SET @n = @n % 999999 + sqrt(@f)
            SET @f = @f + 1
         END
         SET @b = CURRENT_TIMESTAMP
         PRINT ‘Timing = ‘ + ISNULL(CAST(DATEDIFF(MS, @a, @b)AS VARCHAR),”)
         PRINT ‘Res = ‘+ ISNULL(CAST(@n AS VARCHAR),”)
   END

Running this test firstly on firstly CPUs 0-15 and then 16-31 confirms our expectations that with a single-thread 0-15 completes the test in just over 5 seconds

Timing = 5350
Res = 873729.721235

(1 row affected)

Completion time: 2024-12-03T13:22:00.6322394+00:00

and 12 seconds on CPUs 16-31

Timing = 12013
Res = 873729.721235

(1 row affected)

Completion time: 2024-12-03T13:22:59.1543056+00:00

Using this knowledge what if we set for example the CPU affinity to the first 24 CPUs only. Re-running the test show we are now using the performance cores

and seeing a boost in performance

and when the test completes we have now reached the symbolic 1M NOPM in a desktop environment, importantly without any system instabilities.

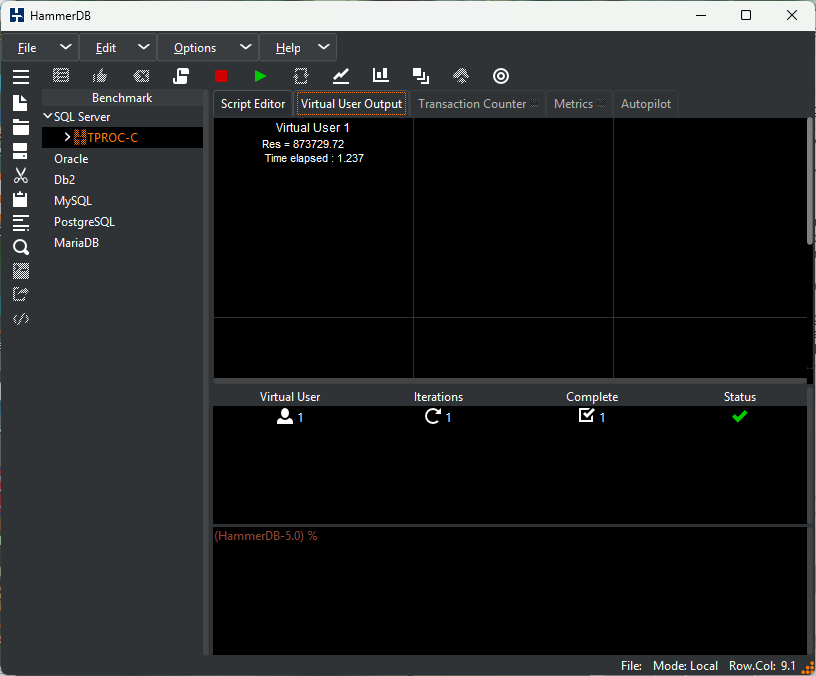
As we have run the CPU single-threaded tests in T-SQL for completeness we can also run the same test within HammerDB itself, with an elapsed time of just over 1 second showing that the client side logic of HammerDB offers high levels of performance compared to database stored procedures.

We can also verify from system tools that the CPU is reaching the levels of frequency expected from the configuration.

(Note that as the test completes so quickly you can increase the number of iterations in the loop to observe the boost in frequency for longer.)

Summary

What we observed from these tests is that ALL hardware and software environments should be stress tested, up to and beyond expected operating conditions to identify potential issues. In this example we found a repeatable way with HammerDB to identify and resolve a CPU instability issue, however issues can also occur for example at the memory and I/O layers, stress testing and observing system logs is the best practice to identify these before the configuration is deployed in production.

We also used the HammerDB CPU metrics to observe the distribution of the CPU utilisation across the available CPUs and use SQL Server CPU affinity to improve performance by 17% over the default configuration using the knowledge we had of this particular CPU’s configuration.

How to analyze PostgreSQL benchmark performance with HammerDB

In this post, we will look at the findings of a blog post by EnterpriseDB analyzing a HammerDB workload against PostgreSQL using Postgres Workload reports. We will provide a brief summary of the article and its conclusions, and demonstrate a better way to analyze PostgreSQL performance with HammerDB itself. We will then highlight the errors that have been made in the EnterpriseDB article and the reasons why.

The EnterpriseDB blog post can be found here, How Postgres Workload Reports Help Optimize Database Operations.

An excellent point that the author makes is that special attention should be given to two specific items: the actual_start_snap_ts (2024-02-15 07:44:18.588779+00) and the actual_end_snap_ts (2024-02-15 07:54:16.587401+00)… This indicates that the database is being evaluated over a 10-minute period. We will remember this point as it gives an indication of the common error made when using analysis based on snapshot type workload reports (we have seen the same error with Oracle AWR reports).

The key findings of the article were as follows:

  1. This server had a HammerDB benchmark running against it. One possibility – and in this case, the most probable conclusion – is that the client test machine was overwhelmed and could not respond to the server fast enough.
  2. The client was waiting for user input, such as a return from a prompt.

It doesn’t mean that something on the server is impacting the system’s throughput. Instead, the issue is with the client.

And the SQL with the highest wait time in the ClientRead wait event was the following:

COPY stock (s_i_id, s_w_id, s_quantity, s_dist_01, s_dist_02, s_dist_03, s_dist_04, s_dist_05, s_dist_06, s_dist_07, s_dist_08, s_dist_09, s_dist_10, s_data, s_ytd, s_order_cnt, s_remote_cnt) FROM STDIN WITH (FORMAT CSV)

An example PostgreSQL manual at AWS gives an indication of why a COPY operation might result in a ClientRead wait event.

During a copy operation, the data is transferred from the client’s file system to the Aurora PostgreSQL DB cluster. Sending a large amount of data to the DB cluster can delay transmission of data from the client to the DB cluster.

But why are we running a COPY operation during a benchmark anyway? To investigate further, we will analyze PostgreSQL performance using HammerDB built-in tools for a deeper insight into the workload.

(Note, we are using the new awbreezedark theme to be introduced with HammerDB v4.13).

Setting up pgSentinel

HammerDB PostgreSQL metrics is based on a superb tool called pgSentinel that brings active session history functionality to PostgreSQL. An active session history allows us to look back at a database workload and see the workload being run over time. Note that this is in contrast to a snapshot/report type functionality that shows us an average of the workload over a period of time, such as 10 minutes. The active session history instead allows us to drill down into specific time periods of interest.

To use pgSentinel we have installed pg_stat_statements and pgsentinel and added the following to our postgresql.conf.

shared_preload_libraries = 'pg_stat_statements,pgsentinel'
track_activity_query_size=2048
pg_stat_statements.save=on
pg_stat_statements.track=all
pgsentinel_pgssh.enable = true
pgsentinel_ash.pull_frequency = 1
pgsentinel_ash.max_entries = 1000000

Building the HammerDB schema

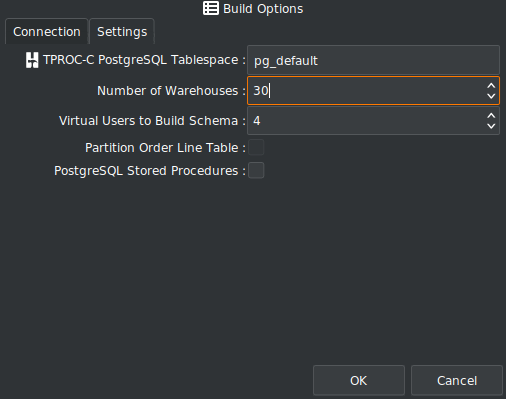
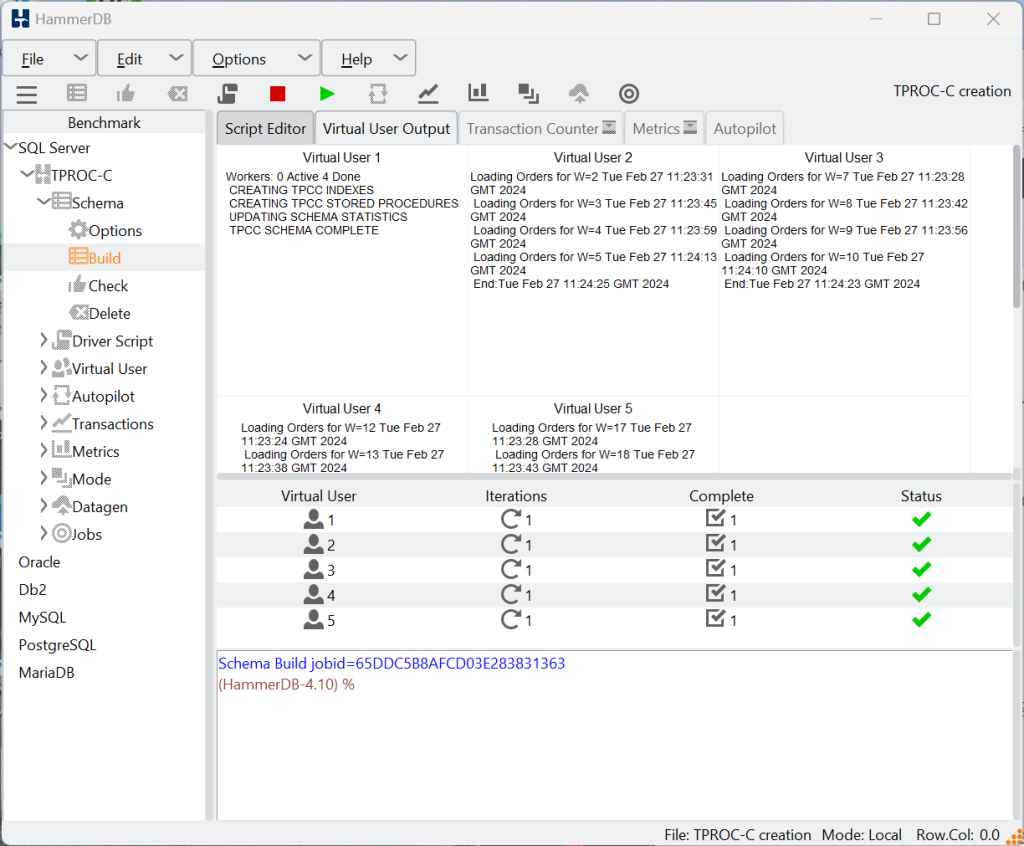
Before we run the workload, we need to install the schema, so for this example running locally on a laptop we are going to configure a 30 warehouse schema with 4 Virtual Users.

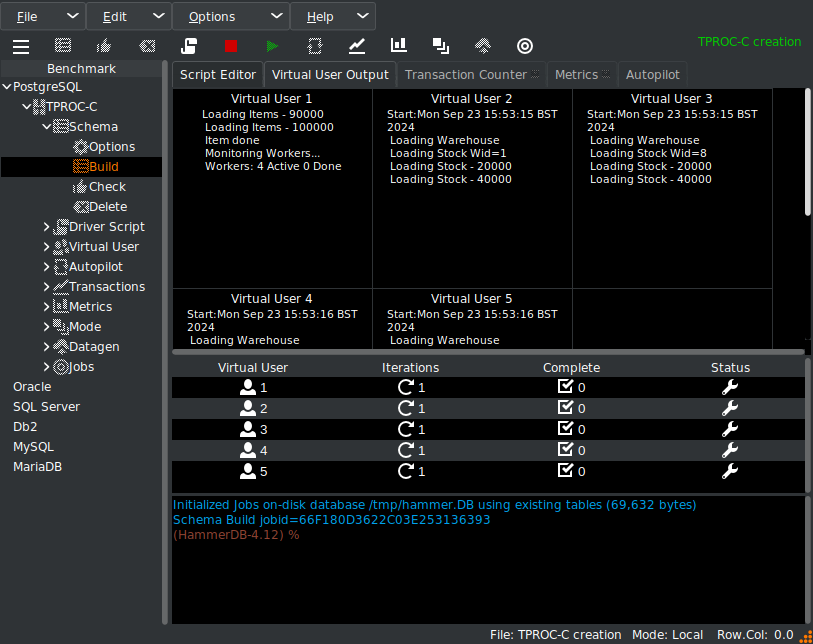
and start the build running.

Press the HammerDB metrics button to start the HammerDB PostgreSQL metrics, collection, grab the Metrics tab in the notebook display, drag it outside the main window and expand to reveal all the metrics being collected over time.  Note if you only have browser access to a remote server you can run HammerDB through the browser, so this functionality is available in all environments.

Deploy HammerDB as a Web Application with CloudTK

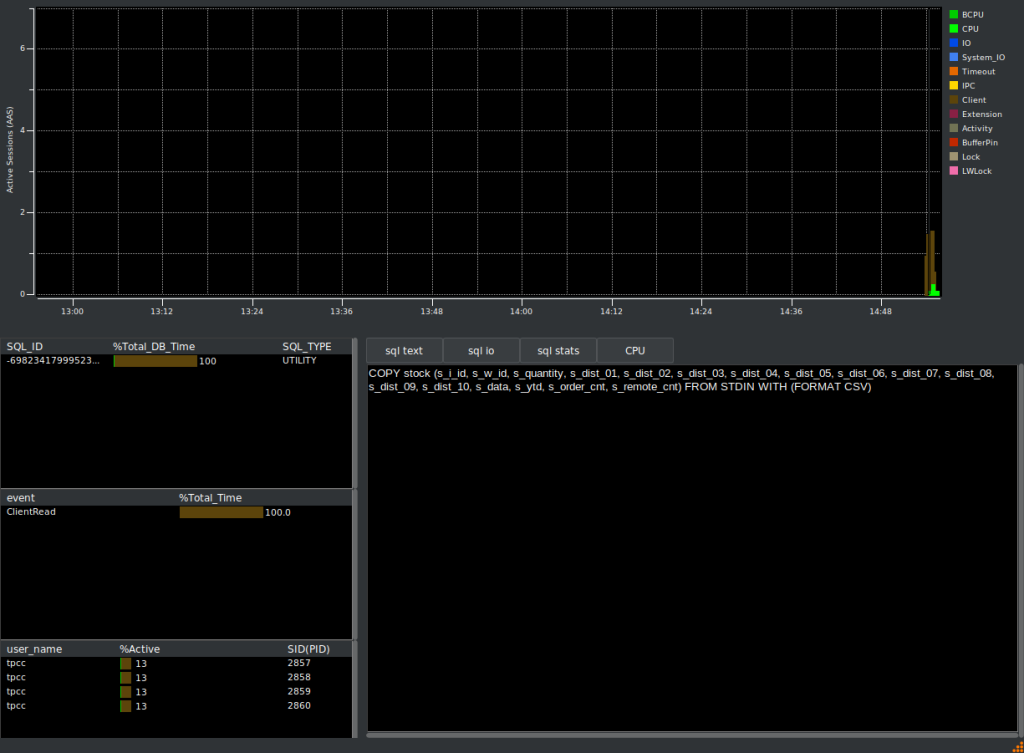
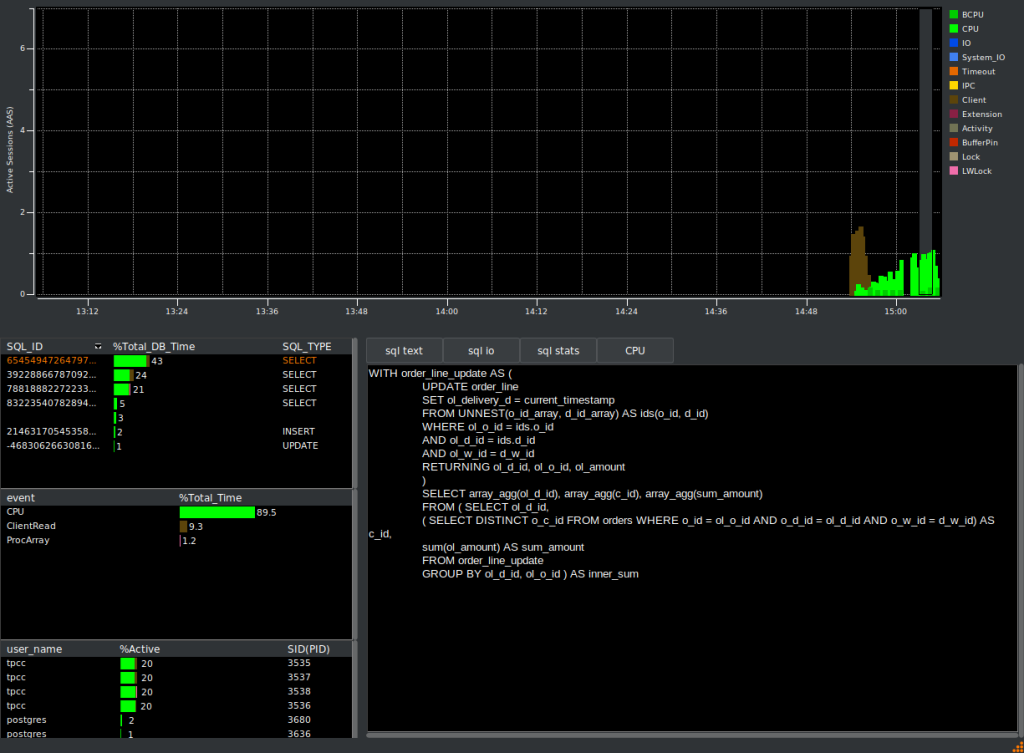
The first thing we see in real time is we have on average 2 active sessions, waiting 100% of the time on ClientRead and the SQL it is waiting on is the same COPY stock statement we saw from the EnterpriseDB blog post. (click on the image to expand for a detailed view).

So this COPY statement is coming from the schema build phase and not the HammerDB benchmark workload at all. It should be clear as shown in the manual that if we are running a COPY statement and transferring a large amount of data, we should expect to spend a lot of time waiting for the client to send that data. The client is not ‘overwhelmed’ at all, this is normal when running a COPY statement.

Running the HammerDB benchmark

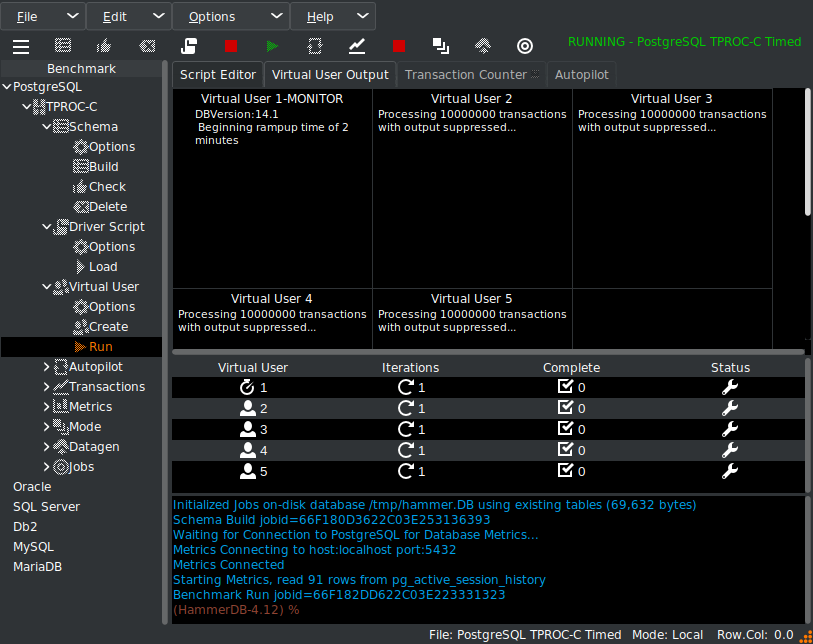
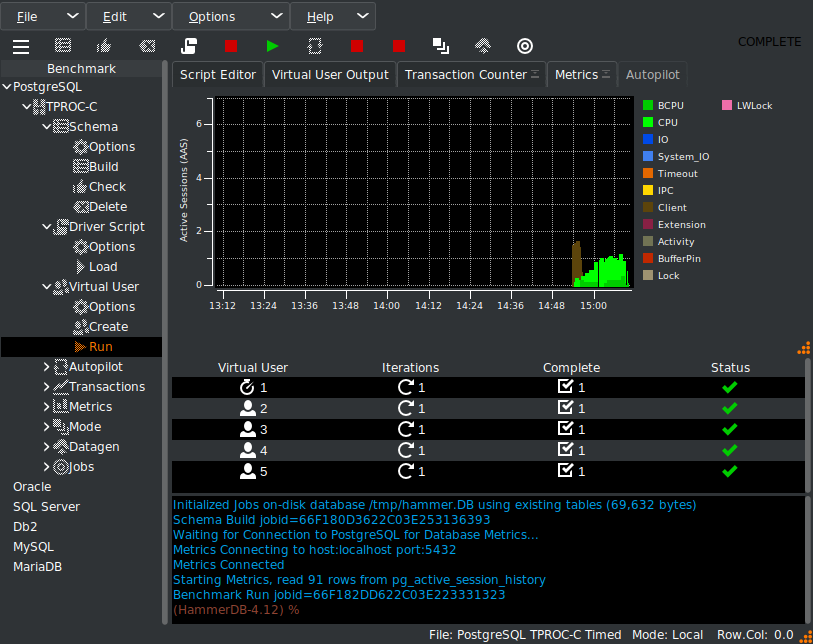
Once the schema build has completed, we run the HammerDB benchmark workload itself.

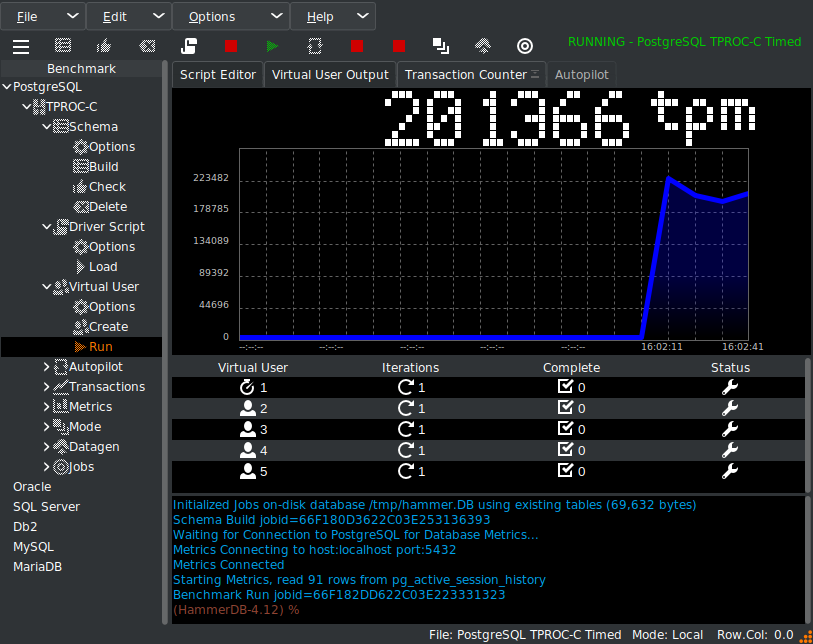
and checking with the transaction counter, we can see we are now running a workload against the PostgreSQL database.

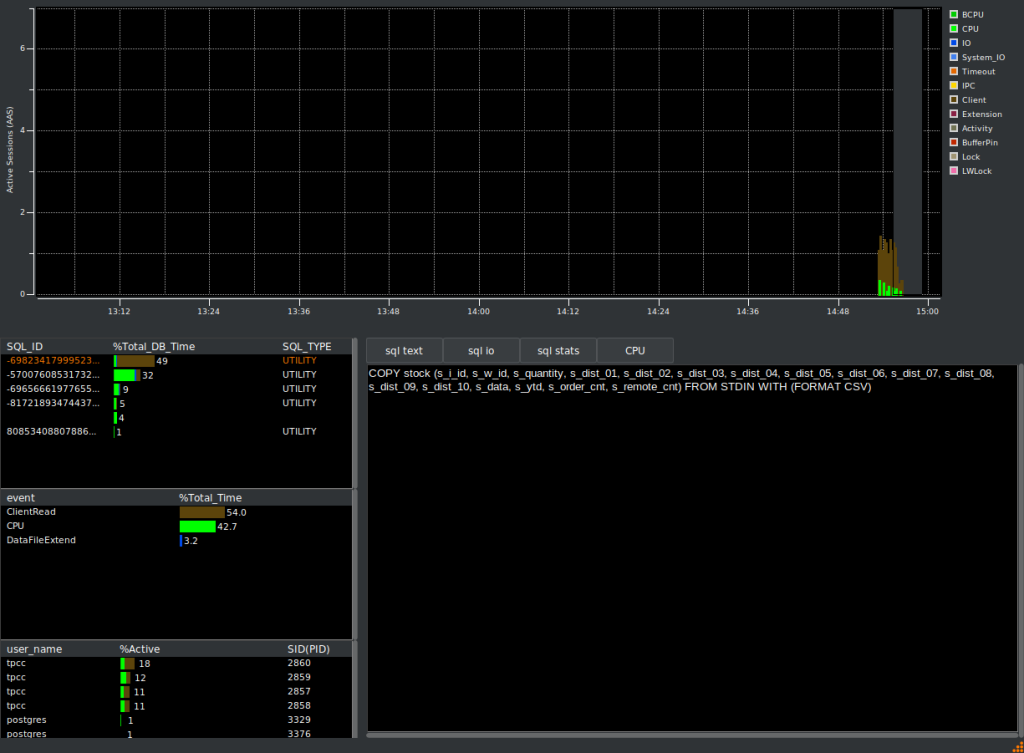
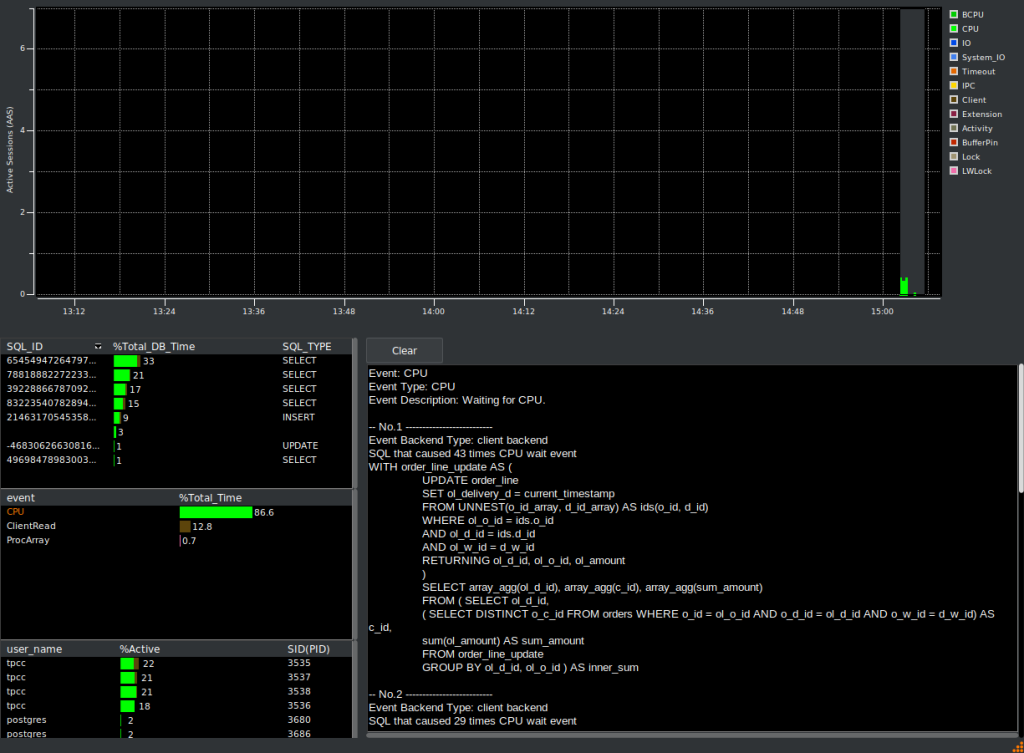
Now if we head back to the HammerDB metrics we will use the selection box in the graph to select a period of time when we are running the benchmark workload rather than the build. It should be clear from the graph itself that although the build is dominated by the ClientRead wait event, now we are running the workload most of our time is spent in foregound CPU and the top SQL is related to the benchmark workload and not the build.

If you click on the CPU event, it will also report the SQL that causes most occurrences of that event, which of courses matches with the top SQL shown first.

If you close the metrics window, it will reattach to HammerDB, experts can use this view for a quick oversight of the wait events experienced by the database.

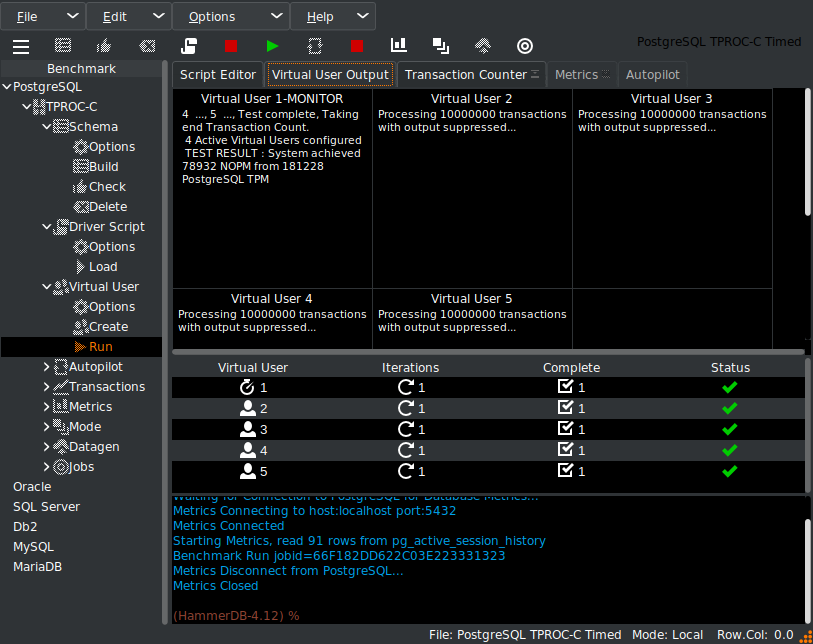
When the workload has completed, HammerDB reports the performance.

So, now it should be clear, the error made by EnterpriseDB in analyzing PostgreSQL performance using workload reports.  The clue is in the special attention paid to the 10-minute period of the workload report. It is highly likely that in this period of time they ran a schema build and a benchmark workload and then mistakenly attributed the build wait events to the workload and reached the wrong overall conclusion (that the client test machine was overwhelmed and could not respond to the server fast enough). Of course, we already know this will not be the case in advance because we use stored procedures to ensure that the workload runs on the server and not the client.

We have learned an important aspect of snapshot type workload reports. Firstly, they show an average of all the work taking place on a database over a period of time, so as in this case if you have 2 separate scenarios (such as schema build and benchmark) in this time period the overall report can be confusing. Secondly, snapshot workload reports are relative. The wait events they show are only relative to the work taking place at that time, so for example, a report from an idle system may have the DBA diagnosing obscure housekeeping related wait events as the DBA taking the snapshot has missed the crucial workload. When using snapshot type reports, pay close attention to what the workload should be that you think you are capturing and clues that you could have made an error.

Instead, using pgSentinel for an active session history approach shows the active sessions over time and their wait events, making it easier to determine that different workloads have been running consecutively.

We looked at the blog post How Postgres Workload Reports Help Optimize Database Operations by EnterpriseDB and saw how using a workload report to analyze a HammerDB workload resulted in an incorrect conclusion. We then presented the HammerDB alternative based on pgSentinel and an active session history approach to illustrate that it was likely EnterpriseDB attributed the wait events from a HammerDB schema build to a benchmark run, thereby reaching this incorrect conclusion.

Of course, workload reports and the active session history complement each other in diagnosing database performance, however with workload reports it is especially important to know what workload is running on the database during the snapshot interval. For example, with the HammerDB Oracle workload a snapshot for an AWR report is taken automatically after the ramp-up period is complete to ensure that the report only shows the database metrics for the workload period.

Using HammerDB in database failure and failover scenarios

A frequently asked question with HammerDB is when a user is using the TPROC-C workload to test database failure and failover scenarios, by deliberately killing connections or shutting down the database during a workload and then restarting it. This post provides a guide to configuring HammerDB for such a scenario and considerations to be aware of when doing so.

Is a TPROC-C workload valid if you have restarted the database?

This is an important consideration that is often missed, so although it seems obvious, it is worth reiterating that benchmarking applications are not typically designed to be disconnected and the database restarted whilst the workload is running. Of course, you can configure your test environment however you wish, and HammerDB is scripted for exactly this flexibility. However, your results will not be valid or comparable to other results. Additionally, as HammerDB is designed as a benchmarking application, there are no plans to extend functionality to automatically recover in-flight tests from database failures. If the database ‘goes away’ during a test, then the test is invalid and the database should be restarted and the benchmark re-run in its entirety.

Nevertheless, having said this, HammerDB has additional functionality to both make multiple connections to test environments and run test scripts multiple times.

Connect pool functionality for clusters

Firstly, when testing clusters, it is possible to configure a pool of connections for HammerDB to use to connect to multiple instances at the same time. We can also configure multiple databases in the same instance to test at the same time as well. In the example below, we have configured this connect pool for PostgreSQL to connect to 3 different databases and round-robin the connections between all of them. Note that you can direct each stored procedure to a different instance, such as read-write vs read-only.

HammerDB-4.11/config/connectpool$ more pgcpool.xml
<connpool>
<connections>
<c1>
<pg_host>localhost</pg_host>
<pg_port>5432</pg_port>
<pg_sslmode>prefer</pg_sslmode>
<pg_user>tpcc1</pg_user>
<pg_pass>tpcc1</pg_pass>
<pg_dbase>tpcc1</pg_dbase>
</c1>
<c2>
<pg_host>localhost</pg_host>
<pg_port>5432</pg_port>
<pg_sslmode>prefer</pg_sslmode>
<pg_user>tpcc2</pg_user>
<pg_pass>tpcc2</pg_pass>
<pg_dbase>tpcc2</pg_dbase>
</c2>
<c3>
<pg_host>localhost</pg_host>
<pg_port>5432</pg_port>
<pg_sslmode>prefer</pg_sslmode>
<pg_user>tpcc3</pg_user>
<pg_pass>tpcc3</pg_pass>
<pg_dbase>tpcc3</pg_dbase>
</c3>
</connections>
<sprocs>
<neworder>
<connections>c1 c2 c3</connections>
<policy>round_robin</policy>
</neworder>
<payment>
<connections>c1 c2 c3</connections>
<policy>round_robin</policy>
</payment>
<delivery>
<connections>c1 c2 c3</connections>
<policy>round_robin</policy>
</delivery>
<stocklevel>
<connections>c1 c2 c3</connections>
<policy>round_robin</policy>
</stocklevel>
<orderstatus>
<connections>c1 c2 c3</connections>
<policy>round_robin</policy>
</orderstatus>
</sprocs>
</connpool>

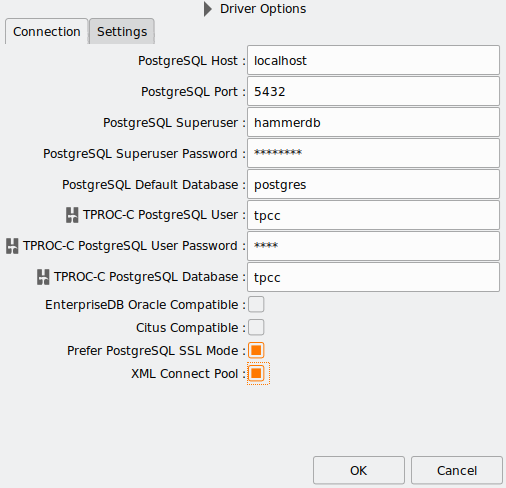
To use this XML configuration, select XML Connect Pool in the connection options.

See this post for more details on configuration.  When we run the workload, we now make a connection to all the configured databases and run the transactions according to the defined policy.

If we look at the configured connections when the workload has started, we can see the multiple connections across the defined databases.  Note in this example the main connection for measuring the NOPM/TPM values connects to the databases tpcc1.

00:00:00 postgres: tpcc1 tpcc1 127.0.0.1(52450) idle
00:00:07 postgres: tpcc1 tpcc1 127.0.0.1(34704) idle
00:00:07 postgres: tpcc2 tpcc2 127.0.0.1(34710) SELECT
00:00:07 postgres: tpcc3 tpcc3 127.0.0.1(34722) idle
00:00:00 postgres: tpcc1 tpcc1 127.0.0.1(34738) idle
00:00:07 postgres: tpcc1 tpcc1 127.0.0.1(34748) idle
00:00:07 postgres: tpcc2 tpcc2 127.0.0.1(34758) idle
00:00:07 postgres: tpcc3 tpcc3 127.0.0.1(34770) SELECT
00:00:00 postgres: tpcc1 tpcc1 127.0.0.1(34786) idle
00:00:07 postgres: tpcc1 tpcc1 127.0.0.1(34788) idle
00:00:07 postgres: tpcc2 tpcc2 127.0.0.1(34792) idle
00:00:07 postgres: tpcc3 tpcc3 127.0.0.1(34804) SELECT
00:00:00 postgres: tpcc1 tpcc1 127.0.0.1(34820) idle
00:00:07 postgres: tpcc1 tpcc1 127.0.0.1(34822) SELECT
00:00:07 postgres: tpcc2 tpcc2 127.0.0.1(34826) idle
00:00:07 postgres: tpcc3 tpcc3 127.0.0.1(34836) idle
00:00:00 postgres: tpcc1 tpcc1 127.0.0.1(34850) idle

When the test has finished, the NOPM/TPM values are reported from the main connection.

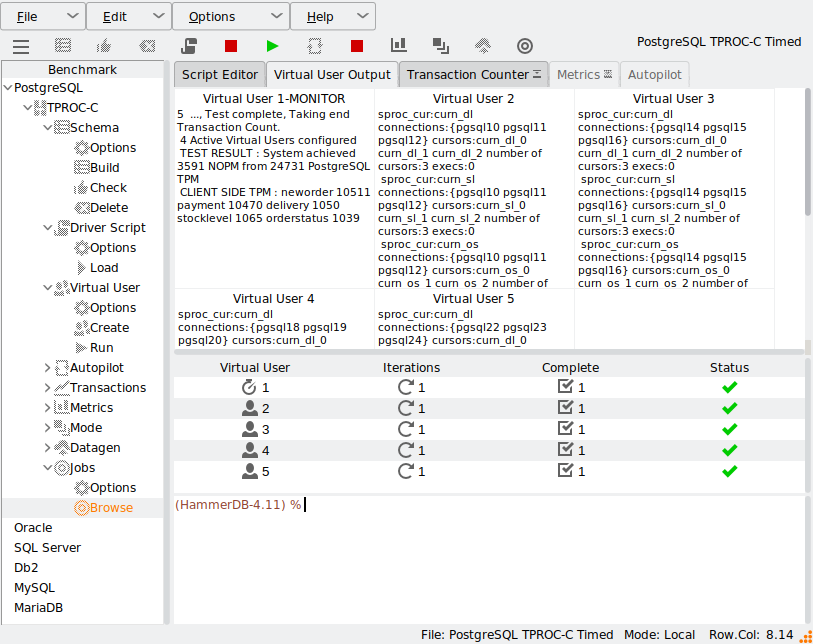
Some databases will report the NOPM from across the cluster but some only per database and therefore this feature will also report the client side TPM to monitor the values per connection.

"4 Active Virtual Users configured",
"1",
"TEST RESULT : System achieved 3591 NOPM from 24731 PostgreSQL TPM",
"2",
"VU2 processed neworder 18343 payment 18127 delivery 1823 stocklevel 1853 orderstatus 1838 transactions",
"0",
"Vuser 2:FINISHED SUCCESS",
"4",
"VU4 processed neworder 18178 payment 18294 delivery 1791 stocklevel 1861 orderstatus 1860 transactions",
"0",
"Vuser 4:FINISHED SUCCESS",
"5",
"VU5 processed neworder 18269 payment 18206 delivery 1824 stocklevel 1866 orderstatus 1819 transactions",
"0",
"Vuser 5:FINISHED SUCCESS",
"3",
"VU3 processed neworder 18789 payment 18668 delivery 1912 stocklevel 1878 orderstatus 1761 transactions",
"0",
"Vuser 3:FINISHED SUCCESS",
"1",
"CLIENT SIDE TPM : neworder 10511 payment 10470 delivery 1050 stocklevel 1065 orderstatus 1039",
"0",
"Vuser 1:FINISHED SUCCESS",
"0",
"ALL VIRTUAL USERS COMPLETE"

When testing clusters, this feature allows you to measure the throughput across multiple instances at the same time and therefore also test the planned failure of some of the databases you are testing.

Virtual User Iterations

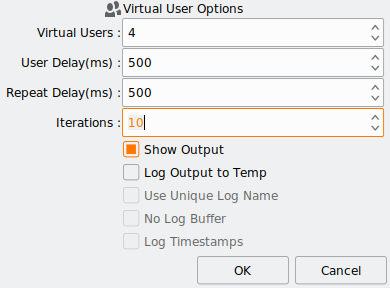
If you want to test killing connections and have HammerDB reconnect, then you should use the Virtual User Iterations feature. You can think of this value as an outer loop around Total Transactions per User set in the Driver Options for a workload. For example, if you change Total Transactions per User to 100,000 and Virtual User Iterations to 10 then each Virtual User will do 1000,000 transactions in total across 10 separate sessions having logged off and on 10 times. Of course, however, if you kill the connection first then the session will also reconnect, allowing you to do the same for failure scenarios.

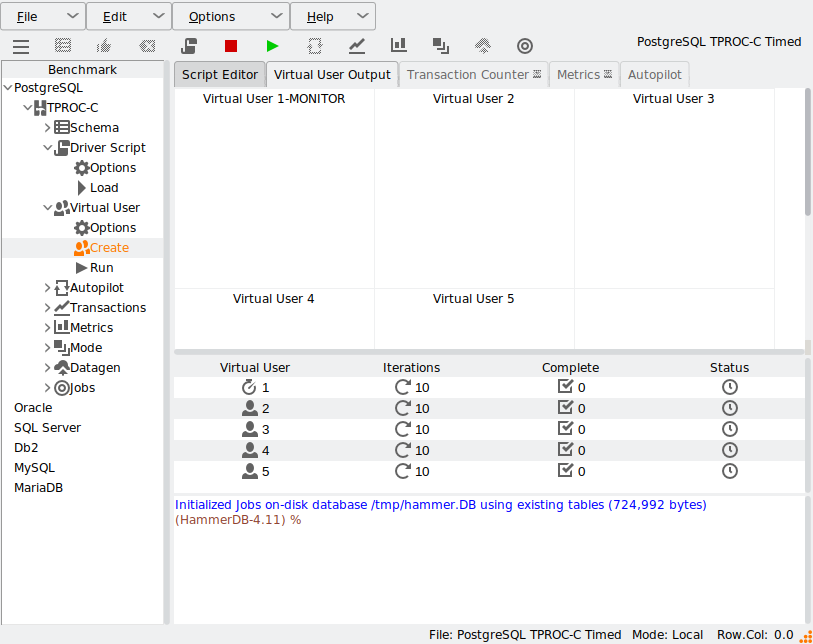
When you create the virtual users, you can see the iterations value in the central panel.

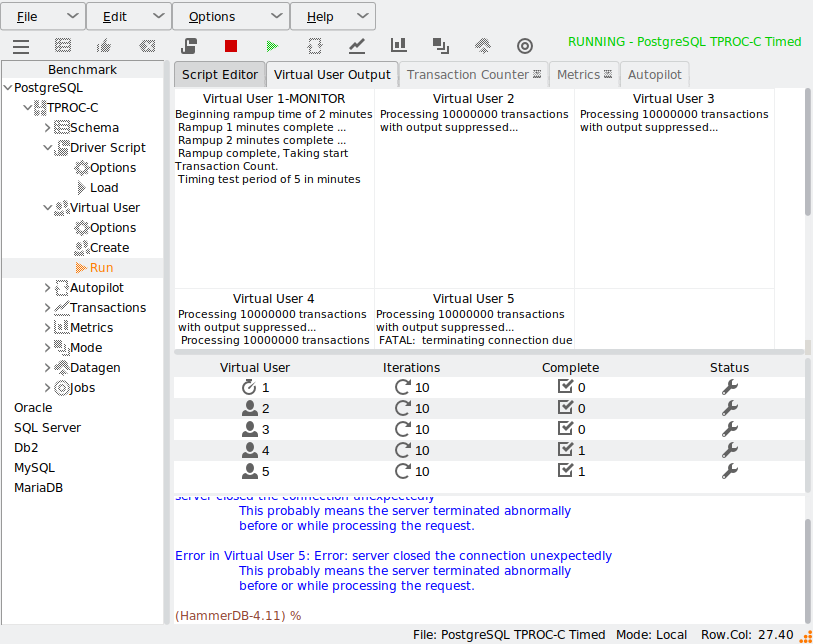
Now if you terminate a session, in this example with select pg_terminate_backend(9011); where 9011 is a Virtual User pid. You can see the error, and that the Virtual User has reconnected.

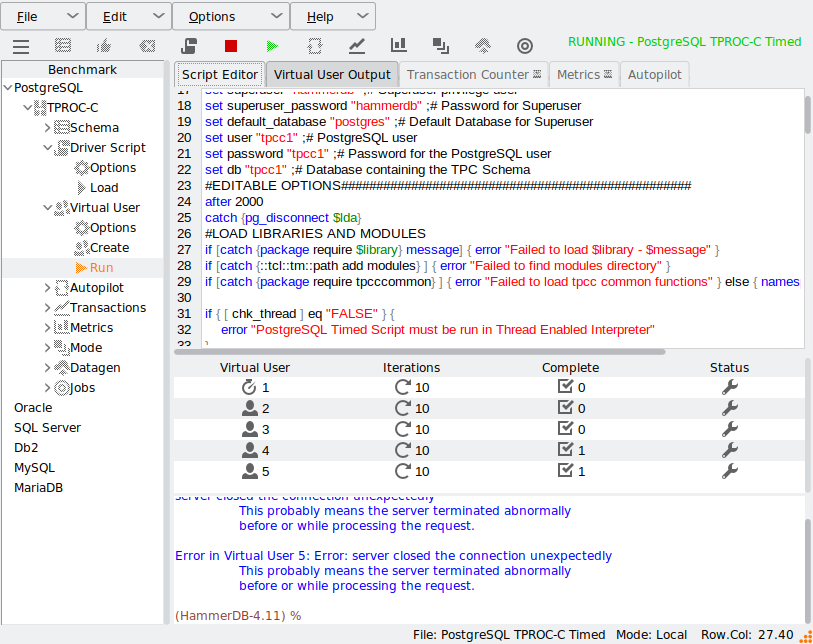
Also note that when killing connections, they can be left in an uncertain state that can result in crashes or errors when the same thread starts running again. Therefore, it is best practice to add a short pause before reconnecting, as shown with the line “after 2000” below and also to preemptively close the connection before trying to reconnect, in this example with catch {pg_disconnect $lda}

Summary

Benchmarking applications are not typically designed for failure and failover scenarios. Nevertheless, HammerDB provides users with the functionality to create their own bespoke test environments that allow them to test multiple instances in a cluster and also to reconnect and restart a test after a failure. Using both features either independently or combined enables having an application that can test database or connection failure instead of benchmarking performance.

Comparing HammerDB TPROC-C results with sysbench-tpcc

In a recent project comparing systems for MariaDB performance, a user had originally been using a tool called sysbench-tpcc to compare hardware platforms before migrating to HammerDB.  However, the user was not aware that the performance could be compared between the 2. This is a brief post to highlight the metrics to use to do the comparison using a separate hardware platform for illustration purposes.

Firstly, it is worth noting that both HammerDB TPROC-C and sysbench-tpcc run workloads based on the TPC-C specification, however as described here HammerDB is called TPROC-C to correctly comply with the TPC fair use rules. 

Also note that whereas HammerDB offers a feature to do a fixed throughput workload close to the specification. In this case, we will only show the workloads run without keying and thinking time, as only HammerDB offers both. HammerDB also runs natively on Windows and Linux with GUI, CLI and Web interfaces on multiple databases, but in this case the example will be on MariaDB on Linux with the CLI.

Prepare or build the schema

Firstly, before running a workload, you need to build or prepare the schema. sysbench-tpcc offers the ability to build multiple schemas to work around scalability issues, however the TPC-C specification uses a single set of tables which can be built as follows.

./tpcc.lua --mysql-socket=/tmp/mariadb.sock --mysql-user=root --mysql-password=maria --mysql-db=tpccsb --time=300 --threads=64 --report-interval=1 --tables=1 --scale=400 --db-driver=mysql prepare

The equivalent in HammerDB is the buildschema command, with example settings as below. The scripts can be in Python or Tcl format.

#!/bin/tclsh
# maintainer: Pooja Jain

puts "SETTING CONFIGURATION"
dbset db maria
dbset bm TPC-C

diset connection maria_host localhost
diset connection maria_port 3306
diset connection maria_socket /tmp/mariadb.sock

set vu 100
set warehouse 400
diset tpcc maria_count_ware $warehouse
diset tpcc maria_num_vu $vu
diset tpcc maria_user root
diset tpcc maria_pass maria
diset tpcc maria_dbase tpcc
diset tpcc maria_storage_engine innodb
if { $warehouse >= 200 } {
diset tpcc maria_partition true
} else {
diset tpcc maria_partition false
}
puts "SCHEMA BUILD STARTED"
buildschema
puts "SCHEMA BUILD COMPLETED"

and run as follows from the command line.

 ./hammerdbcli auto ./scripts/tcl/maria/tprocc/maria_tprocc_build.tcl

You can see that both schemas are similar when built, with the main difference being that sysbench adds prefixes to a number of columns to aid with compression whereas HammerDB is closer to the specification.

MariaDB [tpccsb]> show tables;
+------------------+
| Tables_in_tpccsb |
+------------------+
| customer1        |
| district1        |
| history1         |
| item1            |
| new_orders1      |
| order_line1      |
| orders1          |
| stock1           |
| warehouse1       |
+------------------+
9 rows in set (0.000 sec)

MariaDB [tpccsb]> select * from warehouse1 limit 1;
+------+------------+--------------------+--------------------+-----------------+---------+-----------+-------+------------+
| w_id | w_name     | w_street_1         | w_street_2         | w_city          | w_state | w_zip     | w_tax | w_ytd      |
+------+------------+--------------------+--------------------+-----------------+---------+-----------+-------+------------+
|    1 | name-ussgn | street1-suwfdxnitk | street2-sdptwkrcjd | city-wowgpzhpmq | fu      | zip-12460 |  0.12 | 8398416.00 |
+------+------------+--------------------+--------------------+-----------------+---------+-----------+-------+------------+

MariaDB [tpcc]> show tables;
+----------------+
| Tables_in_tpcc |
+----------------+
| customer       |
| district       |
| history        |
| item           |
| new_order      |
| order_line     |
| orders         |
| stock          |
| warehouse      |
+----------------+
9 rows in set (0.000 sec)

MariaDB [tpcc]> select * from warehouse limit 1;
+------+-----------+--------+----------+---------------+---------------------+--------------------+---------+-----------+
| w_id | w_ytd     | w_tax  | w_name   | w_street_1    | w_street_2          | w_city             | w_state | w_zip     |
+------+-----------+--------+----------+---------------+---------------------+--------------------+---------+-----------+
|    1 | 300000.00 | 0.1800 | kyKhVJqn | ukYR4HaaEJLVi | icFhnjwgqE3cexTJFwR | Kxf1T7pcaHNyvELEIx | lH      | 358511111 |
+------+-----------+--------+----------+---------------+---------------------+--------------------+---------+-----------+

Running the workloads

We can run the workloads as follows, and in the example on both we will use 80 threads or Virtual Users in HammerDB terminology. To run the workload on sysbench-tpcc is the following.

./tpcc.lua --mysql-socket=/tmp/mariadb.sock --mysql-user=root --mysql-password=maria --mysql-db=tpccsb --time=300 --threads=80 --report-interval=1 --tables=1 --scale=400 --db-driver=mysql run

As the workloads are based on the same specification, you can use HammerDB to monitor the sysbench-tpcc workload with the metstart command starting the CPU monitor and tcstart the transaction counter.

hammerdb>metstart
Starting Local Metrics Agent on ubuntu
after#1
hammerdb>Connecting to Agent to Display CPU Metrics
Metric receive port open @ 27702 on ubuntu
Connecting to HammerDB Agent @ localhost:10000
Testing Agent Connectivity...OK
Metrics Connected
Started CPU Metrics for Intel(R) Xeon(R) Platinum 8280L CPU @ 2.70GHz:(112 CPUs)
hammerdb>tcstart
Transaction Counter Started

hammerdb>0 MariaDB tpm
CPU all usr%-0.00 sys%-0.02 irq%-0.00 idle%-99.97
0 MariaDB tpm

and a HammerDB example script as follows:

#!/bin/tclsh
# maintainer: Pooja Jain

set tmpdir $::env(TMP)
puts "SETTING CONFIGURATION"
jobs profileid 0
dbset db maria
dbset bm TPC-C
giset timeprofile xt_gather_timeout 1200
giset commandline keepalive_margin 1200

diset connection maria_host 127.0.0.1
diset connection maria_port 3306
diset connection maria_socket /tmp/mariadb.sock
#
diset tpcc maria_user root
diset tpcc maria_pass maria
diset tpcc maria_dbase tpcc
diset tpcc maria_driver timed
diset tpcc maria_rampup 2
diset tpcc maria_duration 5
diset tpcc maria_no_stored_procs false
diset tpcc maria_allwarehouse false
diset tpcc maria_timeprofile true
diset tpcc maria_purge true
#start CPU
metstart
puts "TEST STARTED"
loadscript
vuset vu 80
vuset logtotemp 1
vucreate
tcstart
tcstatus
vurun
tcstop
vudestroy
#stop CPU
metstop
puts "TEST COMPLETE"

Note that a key parameter here is setting maria_no_stored_procs to true or false. HammerDB uses stored procedures for higher throughput as fully explained here, but also offers a client SQL based version for comparison, sysbench implements a client SQL based version and therefore this is a key understanding for the difference between the 2 workloads. The HammerDB workload is run as shown:
./hammerdbcli auto ./scripts/tcl/maria/tprocc/maria_tprocc_run.tcl

Comparing the results

When running the 80 thread sysbench-tpcc workload, monitoring with HammerDB we can see the following output.

hammerdb>0 MariaDB tpm
CPU all usr%-17.58 sys%-4.18 irq%-0.00 idle%-78.21
485784 MariaDB tpm
CPU all usr%-17.87 sys%-4.30 irq%-0.00 idle%-77.80
497376 MariaDB tpm
CPU all usr%-17.79 sys%-4.36 irq%-0.00 idle%-77.84
478644 MariaDB tpm
CPU all usr%-17.74 sys%-4.35 irq%-0.00 idle%-77.88
485718 MariaDB tpm

and when it has finshed it prints output as follows:

SQL statistics:
    queries performed:
        read:                            31779084
        write:                           32983004
        other:                           4898362
        total:                           69660450
    transactions:                        2449061 (8162.57 per sec.)
    queries:                             69660450 (232173.91 per sec.)
    ignored errors:                      10685  (35.61 per sec.)
    reconnects:                          0      (0.00 per sec.)

Throughput:
    events/s (eps):                      8162.5668
    time elapsed:                        300.0356s
    total number of events:              2449061

Latency (ms):
         min:                                    0.35
         avg:                                    9.80
         max:                                  307.66
         95th percentile:                       41.10
         sum:                             23997083.58

Threads fairness:
    events (avg/stddev):           30613.2625/297.35
    execution time (avg/stddev):   299.9635/0.01

The key figure here is 8162.57 per sec, multiplied by 60 gives us 489,754 TPM (transactions per minute) and is the figure we can use for comparison as can be seen from the HammerDB transaction output giving the same data.

Running HammerDB with stored procedures we can see the difference in CPU utilisation and transactions.
CPU all usr%-52.76 sys%-6.52 irq%-0.00 idle%-40.52
1512462 MariaDB tpm
CPU all usr%-52.85 sys%-6.43 irq%-0.00 idle%-40.55
1519824 MariaDB tpm
CPU all usr%-53.01 sys%-6.47 irq%-0.00 idle%-40.35
1515888 MariaDB tpm
CPU all usr%-52.99 sys%-6.36 irq%-0.00 idle%-40.51
1524312 MariaDB tpm

and it is the TPM value that we use for comparison and not NOPM, as both tools are measuring transactions per second/minute.
Vuser 1:80 Active Virtual Users configured
Vuser 1:TEST RESULT : System achieved 632885 NOPM from 1471425 MariaDB TPM

if we use the HammerDB no stored procedures option we can see that performance drops as would be expected.

Vuser 1:Test complete, Taking end Transaction Count.
Vuser 1:80 Active Virtual Users configured
Vuser 1:TEST RESULT : System achieved 491964 NOPM from 1143635 MariaDB TPM

and refering to the previous article we can see that we are using more system time as we are now spending more time in the network.

1155714 MariaDB tpm
CPU all usr%-52.57 sys%-11.44 irq%-0.00 idle%-35.90
1163382 MariaDB tpm
CPU all usr%-52.73 sys%-11.57 irq%-0.00 idle%-35.61
1154976 MariaDB tpm
CPU all usr%-52.60 sys%-11.71 irq%-0.00 idle%-35.60
1153836 MariaDB tpm
CPU all usr%-52.56 sys%-11.67 irq%-0.00 idle%-35.68

Analyzing results

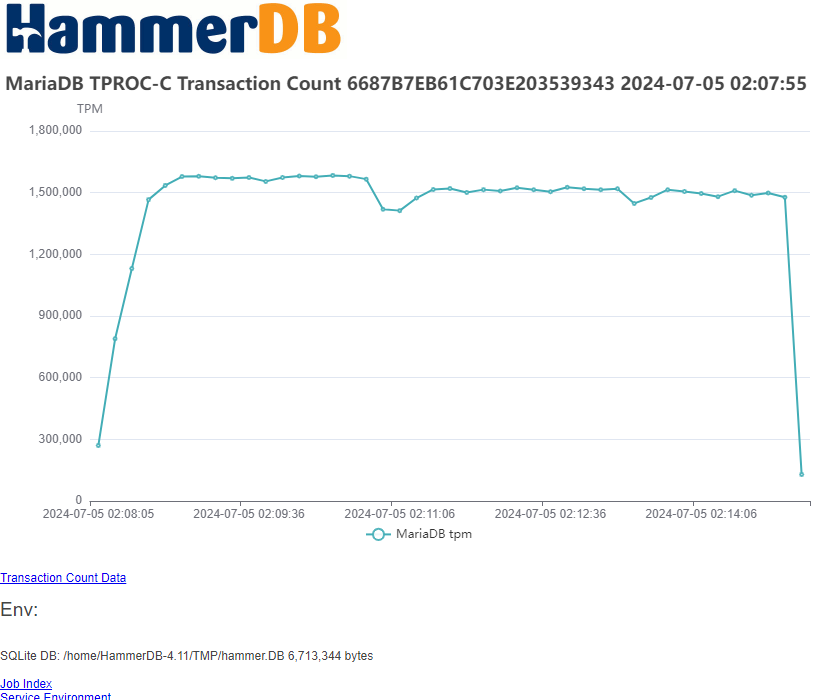
HammerDB will also automatically generate graphs for you to analyze your workload and detailed response times per transaction.

Summary

Of course the more benchmarks and workloads you run against a system, the more insights you can get. All benchmarks are valuable, however it is important to ensure that you deriving accurate results.

In our example a user was initially using sysbench-tpcc to compare different hardware systems for MariaDB however was drawing conclusions about both the hardware and database software capabilities that was not in keeping with our observations. Using this approach we provided an alternative measurement and showed how both approaches compared to illustrate the capabilities of both the hardware and software.


HammerDB v4.11 New Features: CPU Metrics for CLI, GUI and Jobs

One of the key metrics for measuring database performance is CPU utilisation. Therefore since version 2.16 HammerDB has included a CPU monitor in the GUI to graphically observe this utilisation during a workload.

At HammerDB v4.11 the CPU metrics functionality has been enhanced to add the CPU data to the CLI as well as recording this CPU data for HammerDB jobs to view with the HammerDB web service. This post explains the changes to the CPU metrics in HammerDB v4.11 and how to use them.

Capturing CPU utilisation data

HammerDB can record a number of metrics for a workload (such as transaction count and response times) that are stored in the SQLite databases repository for viewing with the web service. HammerDB v4.11 adds the same functionality for the CPU metrics as well as adding a number of commands to the CLI so that the CPU data can be recorded for both.

It is important to note however the distinction between data such as transaction count and CPU utilisation in that the former can be retrieved from the target database with SQL, however the latter requires additional data gathering at the system level. To do this HammerDB uses a separate agent process to gather the CPU utilisation and send it to HammerDB.  If HammerDB is running on a separate system to the database being tested, then the agent needs to run on the system where the database is running.

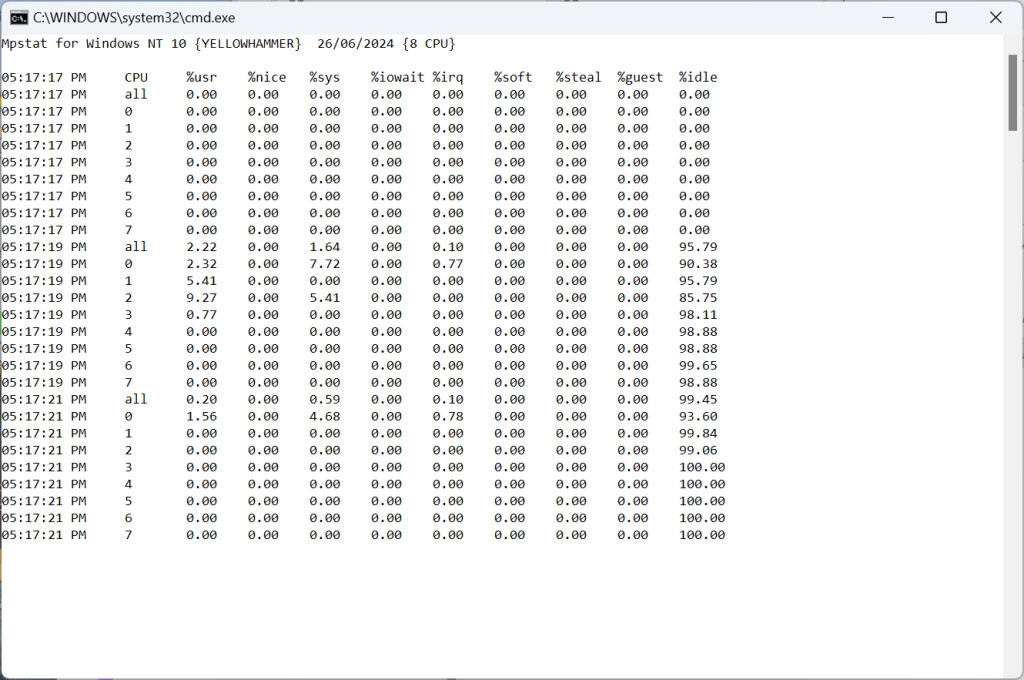
On Linux the HammerDB agent uses the mpstat utility from the sysstat package and therefore this package must be installed on the system being tested.

$ mpstat -V
sysstat version 11.5.7
(C) Sebastien Godard (sysstat <at> orange.fr

On windows the mpstat utility is provided by HammerDB instead and is installed in the agent directory.  This uses the Windows PDH functions to consume the counter data.

If HammerDB is installed on the same system as the database then the agent can be run directly from the HammerDB install. If the database system is separate and HammerDB is connecting over the network then HammerDB should be installed on the database server for running the agent.

Note that you may have already installed HammerDB on both systems as running a schema build locally on the same system will typically be much faster then running a build over the network.

Starting the agent manually

Note that if you are running HammerDB on the same host as the database then you can skip to starting the agent automatically.  However the choice is yours, even if the host is the same then you can still follow the manual process of starting the agent and then connecting display that you have to take when the systems are separate.

The agent can be started manually by running ./agent on Linux or agent.bat on Windows.

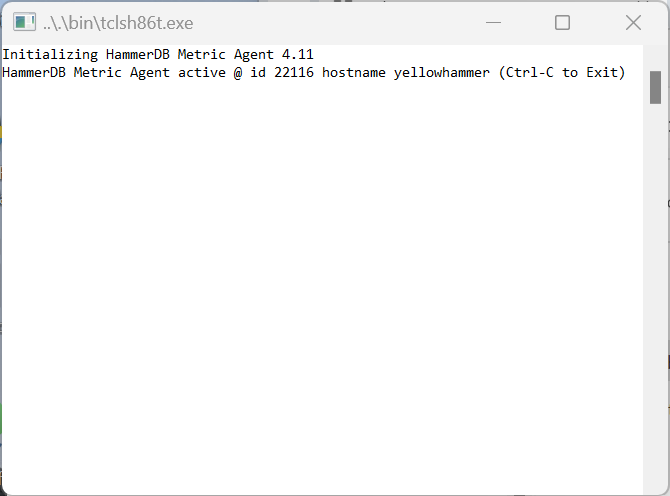
When run without arguments the agent will randomly select a port and report the port and hostname to connect to.

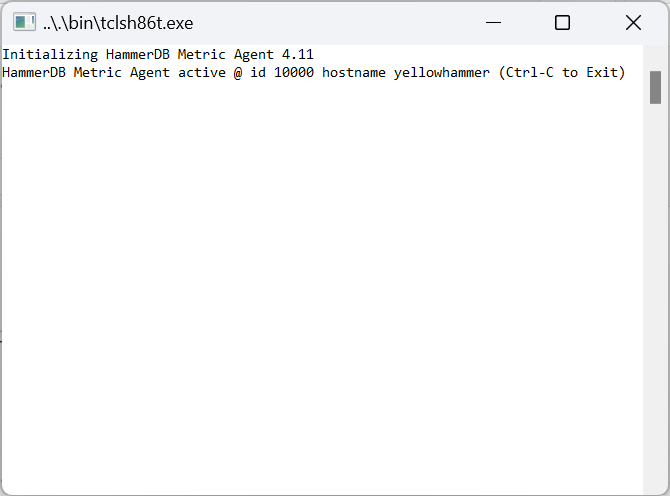
Alternatively, if you provide an argument of a port number to the agent

C:\Program Files\HammerDB-4.11\agent>agent.bat 10000

Then the agent will start with this specified port number

The agent is now ready to be connected to with a display.  When connected the agent will run mpstat and gather and send CPU data to the display.

GUI Metrics interface

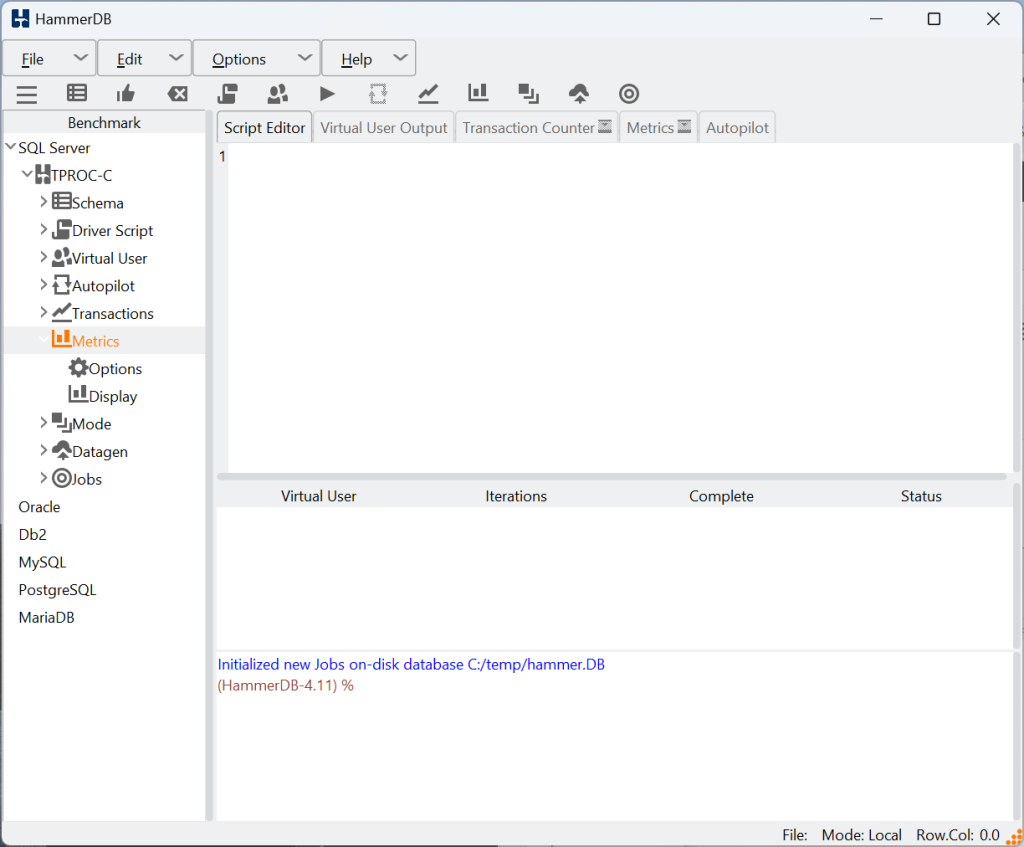
Under the GUI tree view you can see Metrics Options and Display. Options provides the Display with the configuration of the agent to connect to and Display starts the GUI connecting to the Display.

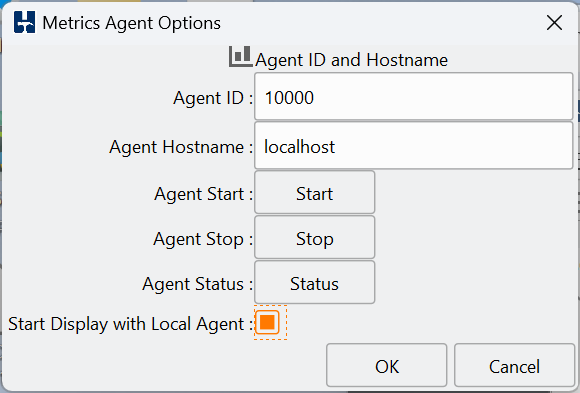
Under the metrics agent options enter the Agent ID that was either randomly chosen or specified when the agent was started and the hostname it is running on, either local or remote.

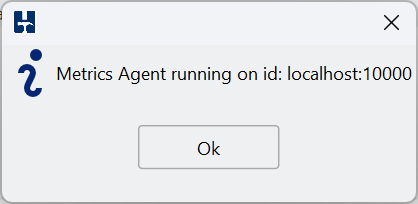
If the hostname is the localhost, then you can verify if the agent is running with the Agent Status button. As we already started the agent manually on port 10000 then we can see that HammerDB reports that the agent is already running.

Note that you can also see that we have the options to start and stop the agent from the GUI when we are running both the agent and the GUI on the same host.  This starts and stops the agent in exactly the same way as described when running manually with providing the port number that you have specified under Agent ID.

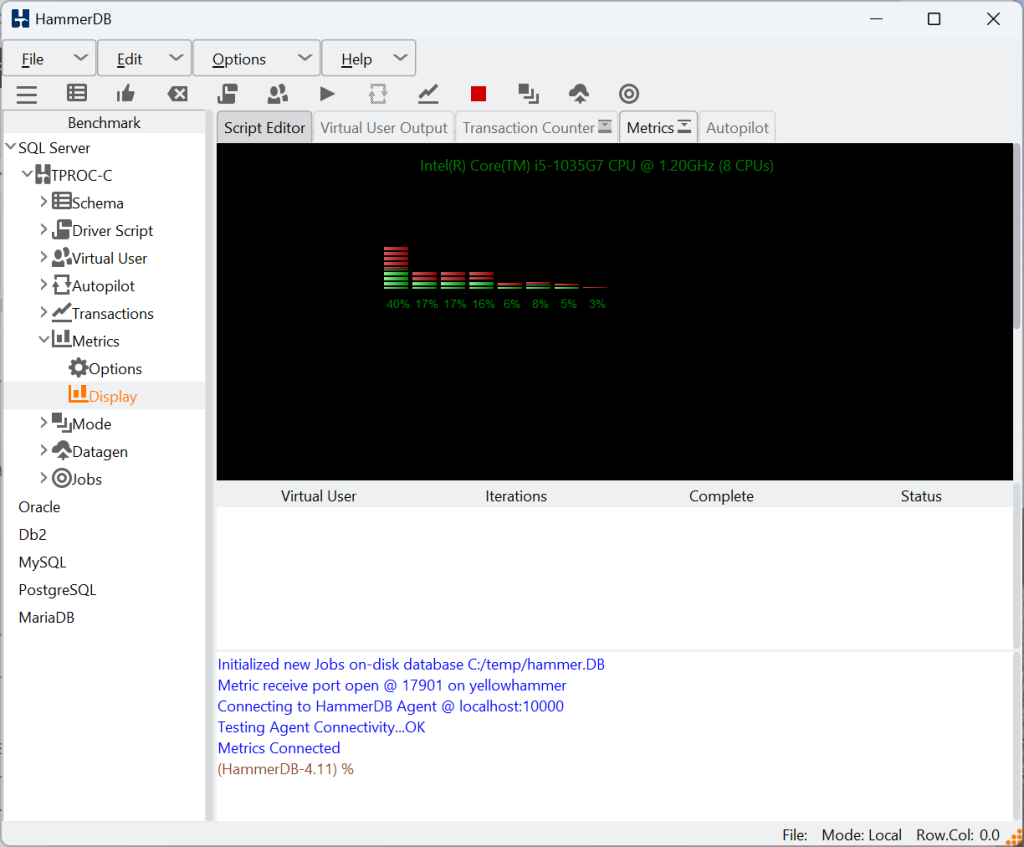
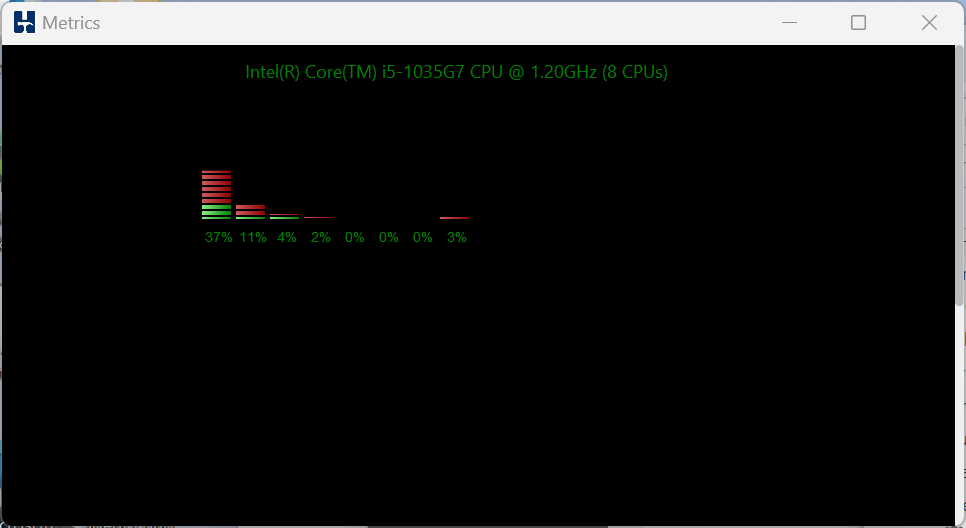
With the agent running either locally or remotely, click Display in the tree view, the HammerDB Display will now connect to the tree view and begin showing the CPU metrics.

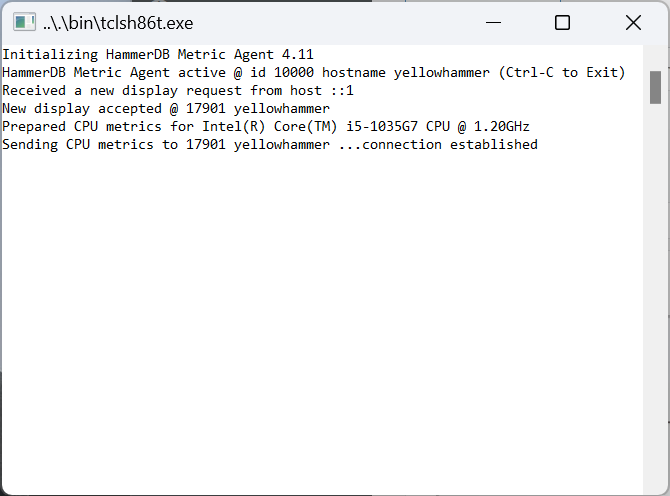
Note that the agent will also report that a Display has connected.

Also the metrics window can be dragged out of HammerDB to display standalone, or if closed will return to the HammerDB notebook.

Finally, if you select the Start Display with Local Agent checkbox, if this is selected and you click Agent Start, then both the Agent and Display will start running on the localhost in a single step.

CLI Metrics interface

The CLI metrics interface follows the same steps as the GUI. Firstly use the print generic command to observer the metrics settings.

hammerdb>print generic
Generic Dictionary Settings
...
metrics              {
 agent_hostname = localhost
 agent_id       = 10000
}
...

The metset command can be used to change the agent_hostname or agent_id.

hammerdb>metset
Usage: metset [agent_hostname|agent_id] value

The metstart command is used to start the CLI metrics display.  If the agent host is the localhost and the agent is not already running then metstart will also start the agent.

hammerdb>metstart
Starting Local Metrics Agent on ubuntu
after#1
hammerdb>Connecting to Agent to Display CPU Metrics
Metric receive port open @ 37065 on ubuntu
Connecting to HammerDB Agent @ localhost:10000
Testing Agent Connectivity...OK
Metrics Connected
Started CPU Metrics for Intel(R) Xeon(R) Platinum 8280L CPU @ 2.70GHz:(112 CPUs)
CPU all usr%-0.06 sys%-0.04 irq%-0.00 idle%-99.87
CPU all usr%-0.08 sys%-0.04 irq%-0.00 idle%-99.85
CPU all usr%-0.06 sys%-0.03 irq%-0.00 idle%-99.90
CPU all usr%-0.04 sys%-0.03 irq%-0.00 idle%-99.91
...

metstatus checks whether the agent is running. Note that because the agent is a remote process then there may be some delay between starting the metrics and the status returning as running.

hammerdb>metstatus
CPU Metrics are running on ubuntu
Metrics Agent running on localhost:10000

Finally metstop stops the display and agent.

hammerdb>metstop
Stopping Metrics Agent and Display on localhost:10000

Typically these commands will be included in a script as follows:

set tmpdir $::env(TMP)
puts "SETTING CONFIGURATION"
jobs profileid 0
dbset db maria
dbset bm TPC-C
giset timeprofile xt_gather_timeout 1200
giset commandline keepalive_margin 1200

diset connection maria_host 127.0.0.1
diset connection maria_port 3306
diset connection maria_socket /tmp/mariadb.sock
#
diset tpcc maria_user root
diset tpcc maria_pass maria
diset tpcc maria_dbase tpcc
diset tpcc maria_driver timed
diset tpcc maria_rampup 2
diset tpcc maria_duration 5
diset tpcc maria_no_stored_procs false
diset tpcc maria_allwarehouse false
diset tpcc maria_timeprofile true
diset tpcc maria_purge true
#start CPU
metstart
puts "TEST STARTED"
loadscript
vuset vu 80
vuset logtotemp 1
vucreate
tcstart
tcstatus
vurun
tcstop
vudestroy
#stop CPU
metstop
puts "TEST COMPLETE"

and when the script is run you can observe that the CPU utilization is reported. Note that the difference from the GUI is that the CLI reports utilization for all CPUs whereas in the GUI you can observe the individual cores.

 ./hammerdbcli auto ./scripts/tcl/maria/tprocc/maria_tprocc_run_80vu.tcl
...
Vuser 1:Rampup 1 minutes complete ...
1616094 MariaDB tpm
CPU all usr%-56.20 sys%-7.32 irq%-0.00 idle%-36.39
1621218 MariaDB tpm
CPU all usr%-56.71 sys%-7.29 irq%-0.00 idle%-35.94
1605342 MariaDB tpm
CPU all usr%-56.55 sys%-7.18 irq%-0.00 idle%-36.19
1614732 MariaDB tpm
CPU all usr%-56.67 sys%-7.34 irq%-0.00 idle%-35.94
...
Vuser 28:FINISHED SUCCESS
Vuser 29:FINISHED SUCCESS
Vuser 1:Calculating timings...
Vuser 1:Writing timing data to /home/HammerDB-4.11/TMP/hdbxtprofile.log
CPU all usr%-4.81 sys%-0.33 irq%-0.00 idle%-89.32
111918 MariaDB tpm
CPU all usr%-2.82 sys%-0.17 irq%-0.00 idle%-96.98
0 MariaDB tpm
CPU all usr%-2.73 sys%-0.13 irq%-0.00 idle%-97.11
0 MariaDB tpm
CPU all usr%-2.84 sys%-0.11 irq%-0.00 idle%-97.03
0 MariaDB tpm
Vuser 1:Starting purge: history list length 3044852
CPU all usr%-2.67 sys%-0.08 irq%-0.00 idle%-97.23
0 MariaDB tpm
CPU all usr%-2.83 sys%-0.08 irq%-0.00 idle%-97.05
0 MariaDB tpm
CPU all usr%-2.61 sys%-0.09 irq%-0.00 idle%-97.21
0 MariaDB tpm
CPU all usr%-2.87 sys%-0.08 irq%-0.00 idle%-96.99
0 MariaDB tpm
CPU all usr%-3.00 sys%-0.07 irq%-0.00 idle%-96.88
0 MariaDB tpm
CPU all usr%-3.03 sys%-0.07 irq%-0.00 idle%-96.82
0 MariaDB tpm
CPU all usr%-2.94 sys%-0.11 irq%-0.00 idle%-96.85
0 MariaDB tpm
Vuser 1:Purge complete in 0 hrs:01 mins:11 secs
Vuser 1:Starting write back: dirty buffer pages 1161320
CPU all usr%-0.77 sys%-0.25 irq%-0.00 idle%-98.27
0 MariaDB tpm
Vuser 1:Write back complete in 0 hrs:00 mins:14 secs
Vuser 1:FINISHED SUCCESS
ALL VIRTUAL USERS COMPLETE
Transaction Counter thread running with threadid:tid0x7f83cd7fa700
Stopping Transaction Counter
vudestroy success
Stopping Metrics Agent and Display on localhost:10000
TEST COMPLETE

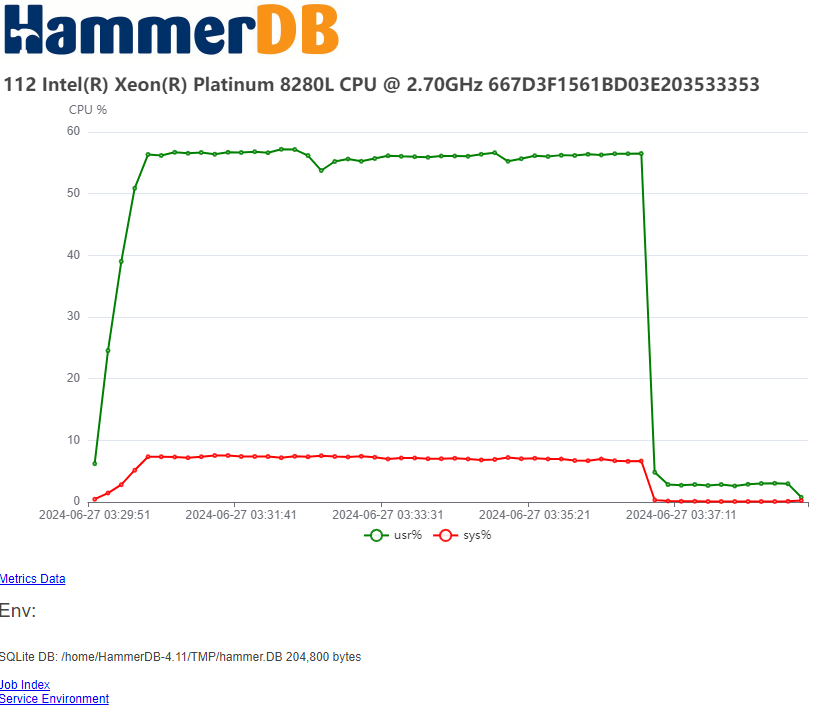
When the job has finished the new job system command will record the name of the CPU and the number of cores.

hammerdb>job 667D3F1561BD03E203533353 system
[
  "Intel(R) Xeon(R) Platinum 8280L CPU @ 2.70GHz",
  "112"
]

and the job metrics command will show the CPU utilization data for a particular job.

hammerdb>job 667D3F1561BD03E203533353 metrics
{
  "2024-06-27 03:29:51": {
    "usr%": "6.21",
    "sys%": "0.46",
    "irq%": "0.0",
    "idle%": "90.63"
  },
  "2024-06-27 03:30:01": {
    "usr%": "24.55",
    "sys%": "1.45",
    "irq%": "0.0",
    "idle%": "72.86"
  },
  "2024-06-27 03:30:11": {
    "usr%": "39.02",
    "sys%": "2.81",
    "irq%": "0.0",
    "idle%": "57.01"
  },
  "2024-06-27 03:30:21": {
    "usr%": "50.87",
    "sys%": "5.16",
    "irq%": "0.0",
    "idle%": "42.97"
  },
...
}

Viewing Metrics with the Web Service

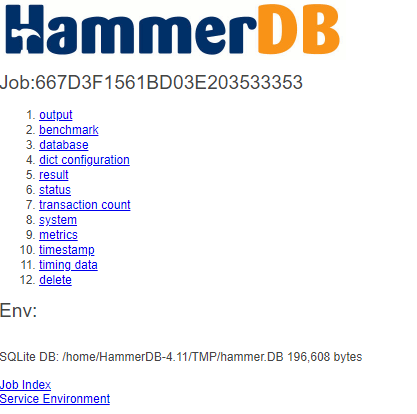
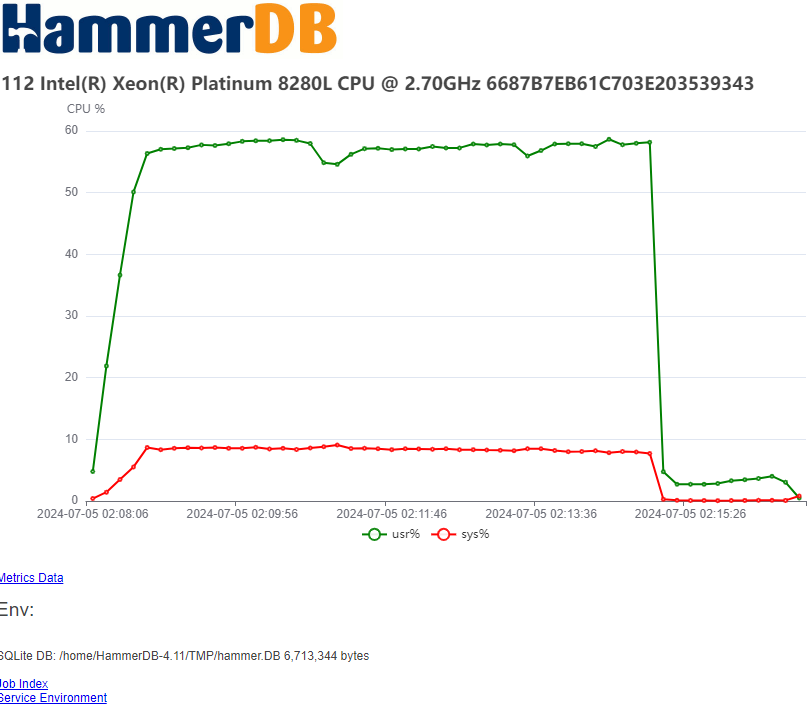
When you run a job with the CPU metrics running, either in the GUI or in the CLI the job will record the CPU that the workload is running on and the metrics data. Note that if the metrics is not running then the metrics and system links will be missing for a particular job.

In the example we can see that the metrics was running for this job and the system and metrics links are present.

The system link reports the CPU that the job was run against.

and the metrics link shows a graph for user% and sys% across the time the job was run.

Summary

HammerDB v4.11 adds functionality to improve capturing CPU utilisation during a job and storing this data for displaying along with other job related data. It also adds the metset, metstart, metstop and metstatus commands to run and capture CPU utilisation from the CLI interface.

HammerDB v4.11 New Features: Performance Profiles for TPROC-C Workloads

Arguably, the most common beginning errors with database benchmarking is for a user to select a single point of utilisation (usually overconfigured)  and then extrapolate conclusions about system performance from this single point. Instead, HammerDB has always encouraged the building of performance profiles to fully understand how a database system behaves.

HammerDB v4.11 automates this practice by introducing the concept of performance profiles for TPROC-C workloads. This functionality available with both GUI and CLI enables you to group a number of related TPROC-C workloads together to build a profile across multiple benchmarks.

Typically, this functionality will be used with an automated workload where you have defined an increasing sequence of Virtual Users to identify the levels of peak performance on a system or compare different software and hardware configurations.  The performance profile allows you to group these related TPROC-C workloads together with a single profile ID.

By default, the performance profile ID is set to 0 meaning that a particular HammerDB job is not related to other jobs and by setting this profile ID to a positive integer then groups all jobs with the same number together.

Using Performance Profiles with Autopilot

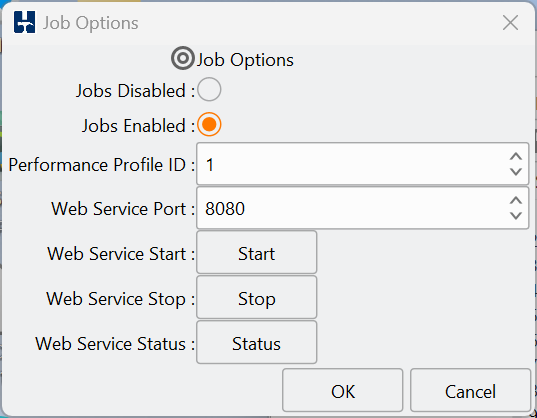
In the GUI, when jobs are enabled, there is the new option of performance profile ID. To activate performance profiles set this ID to a positive value with the Job Options dialog.

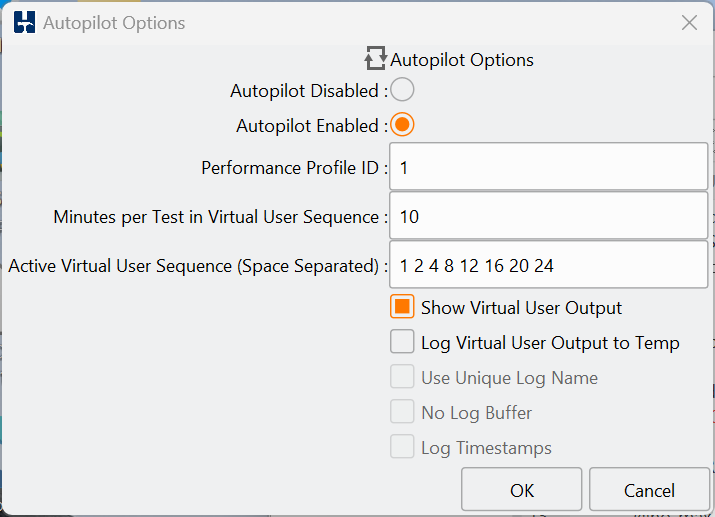
As this setting is related to automated workloads the same setting is also available in the Autopilot options.

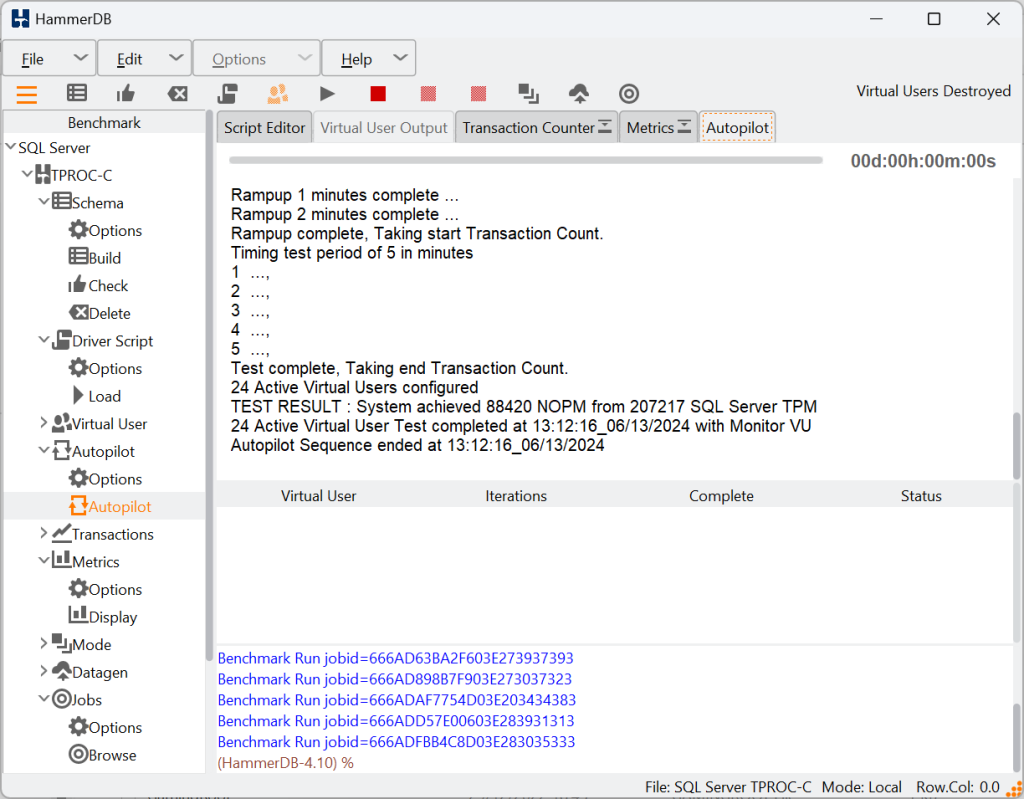
Then run an autopilot sequence exactly as before.

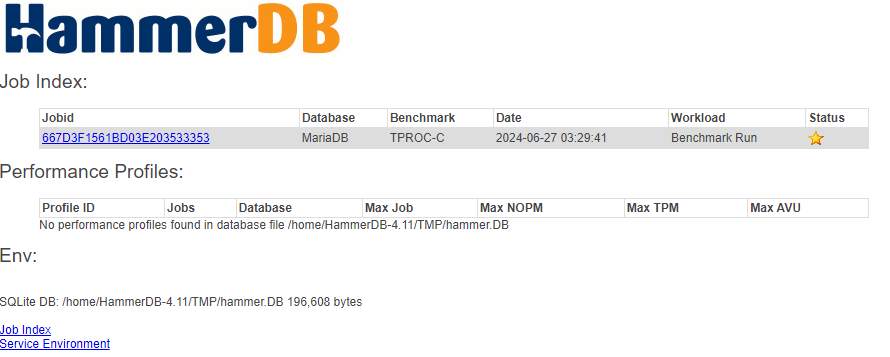
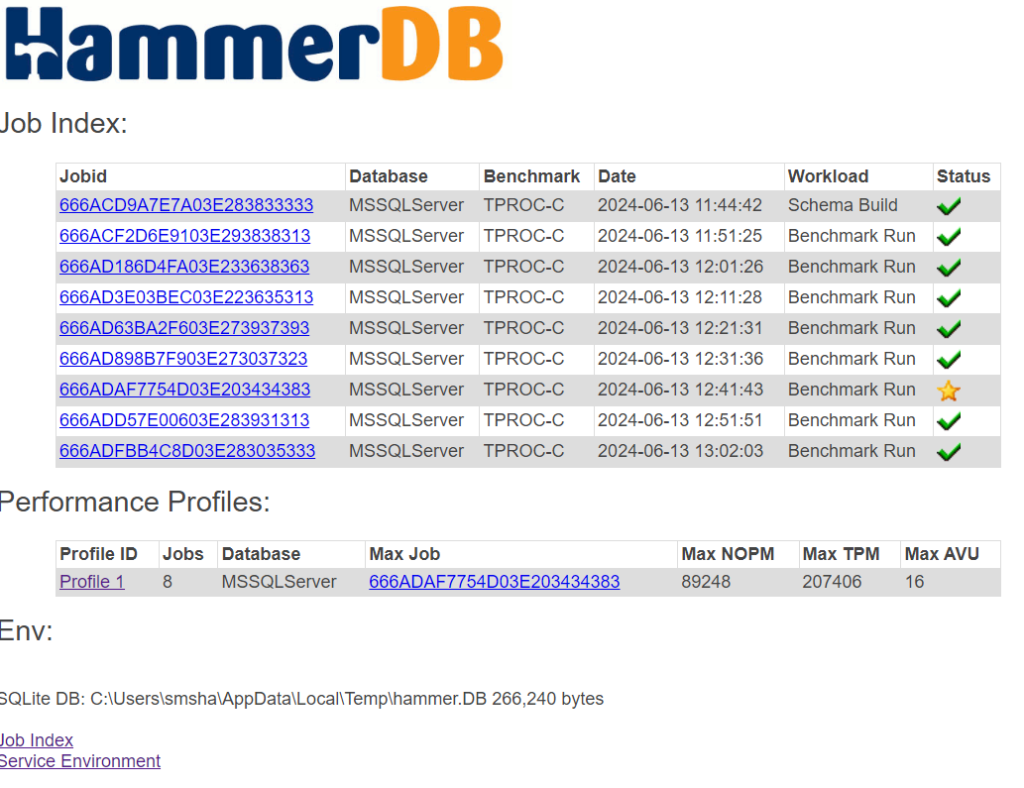
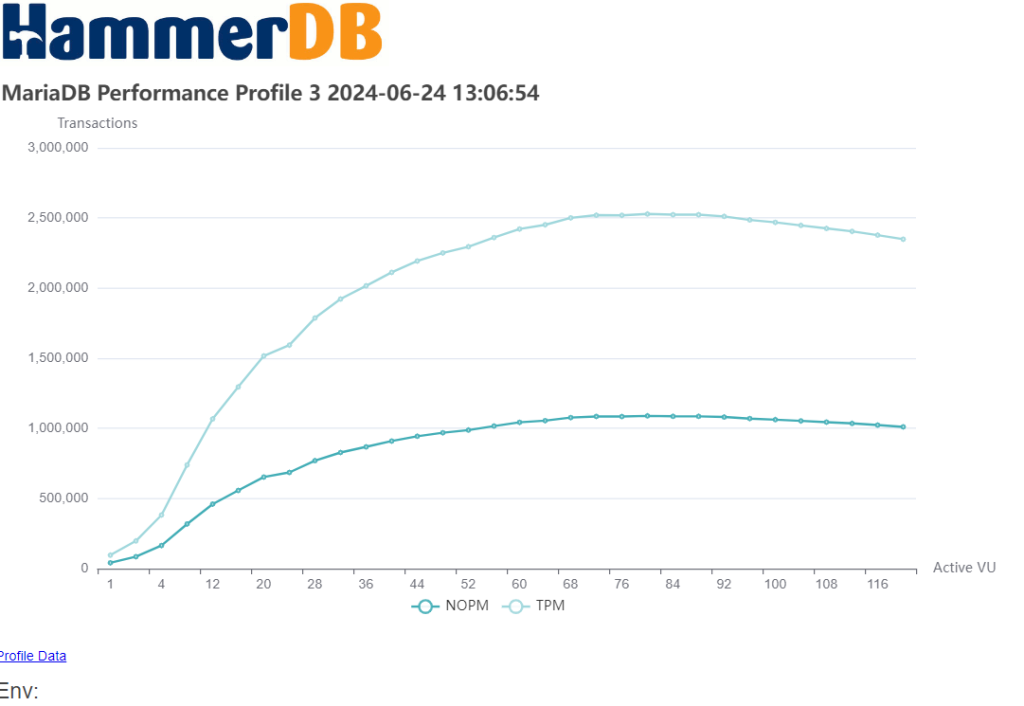
When the run has completed, view your results with the HammerDB web service and you will see a new section called Performance Profiles and a profile listed under the ID you have created.  The profile lists the number of Jobs grouped under that ID and pinpoints the job with the maximum NOPM and TPM for that job and the number of Active Virtual Users.

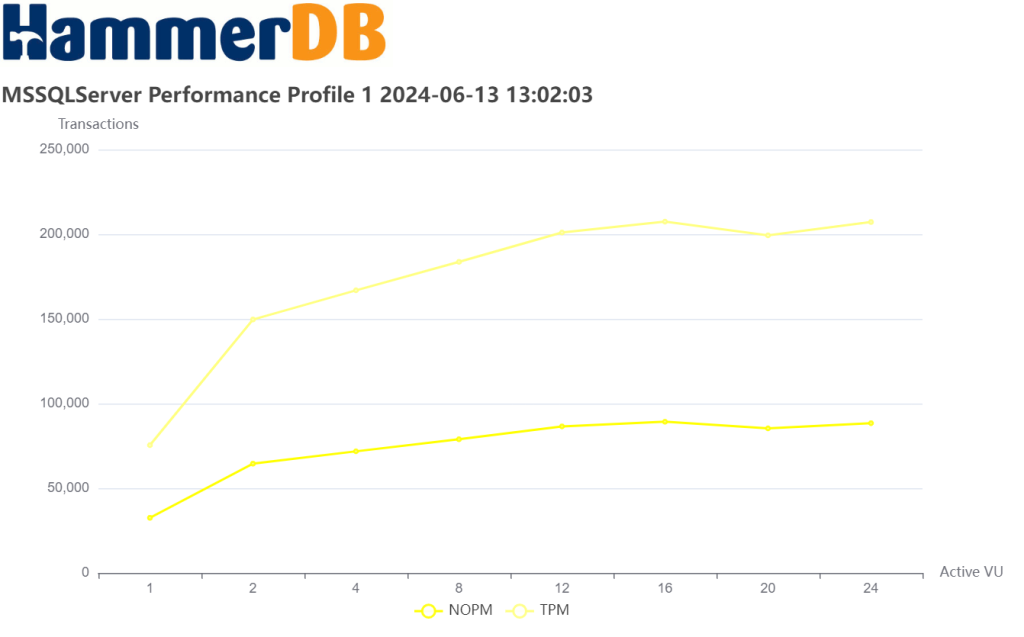
Clicking on the profile ID will show a graph of both NOPM and TPM (both of which can be interactively deselected) allowing you to view the performance profile for your grouped jobs.

Using Performance Profiles with the CLI

In advanced server environments, most users will use scripts to run a performance profile sequence. The equivalent of setting the Performance Profile ID in the GUI is done with the jobs profileid command. Without an argument it will report the current profile ID, by default 0 for no profile and with an integer argument it will set a Profile ID.

hammerdb>jobs profileid Performance profile id set to 0

hammerdb>jobs profileid 1 Setting performance profile id to 1

hammerdb>jobs profileid Performance profile id set to 1

If running a sequence of tests as follows, setting the Profile ID requires just one command before any of the workload is run.

#!/bin/tclsh
# maintainer: Pooja Jain

set tmpdir $::env(TMP)
puts "SETTING CONFIGURATION"
jobs profileid 1
dbset db maria
dbset bm TPC-C
giset timeprofile xt_gather_timeout 1200
giset commandline keepalive_margin 1200

diset connection maria_host 127.0.0.1
diset connection maria_port 3306
diset connection maria_socket /tmp/mariadb.sock
#
diset tpcc maria_user root
diset tpcc maria_pass maria
diset tpcc maria_dbase tpcc
diset tpcc maria_driver timed
diset tpcc maria_rampup 2
diset tpcc maria_duration 5
diset tpcc maria_no_stored_procs false
diset tpcc maria_allwarehouse false
diset tpcc maria_timeprofile true
diset tpcc maria_purge true
#start CPU
metstart
puts "TEST STARTED"
foreach z { 1 2 4 8 12 16 20 24 28 32 36 40 44 48 52 56 60 64 68 72 76 80 84 88
92 96 100 104 108 112 116 120 } {
loadscript
vuset vu $z
vuset logtotemp 1
vucreate
tcstart
tcstatus
vurun
tcstop
vudestroy
}
metstop
puts "TEST COMPLETE"

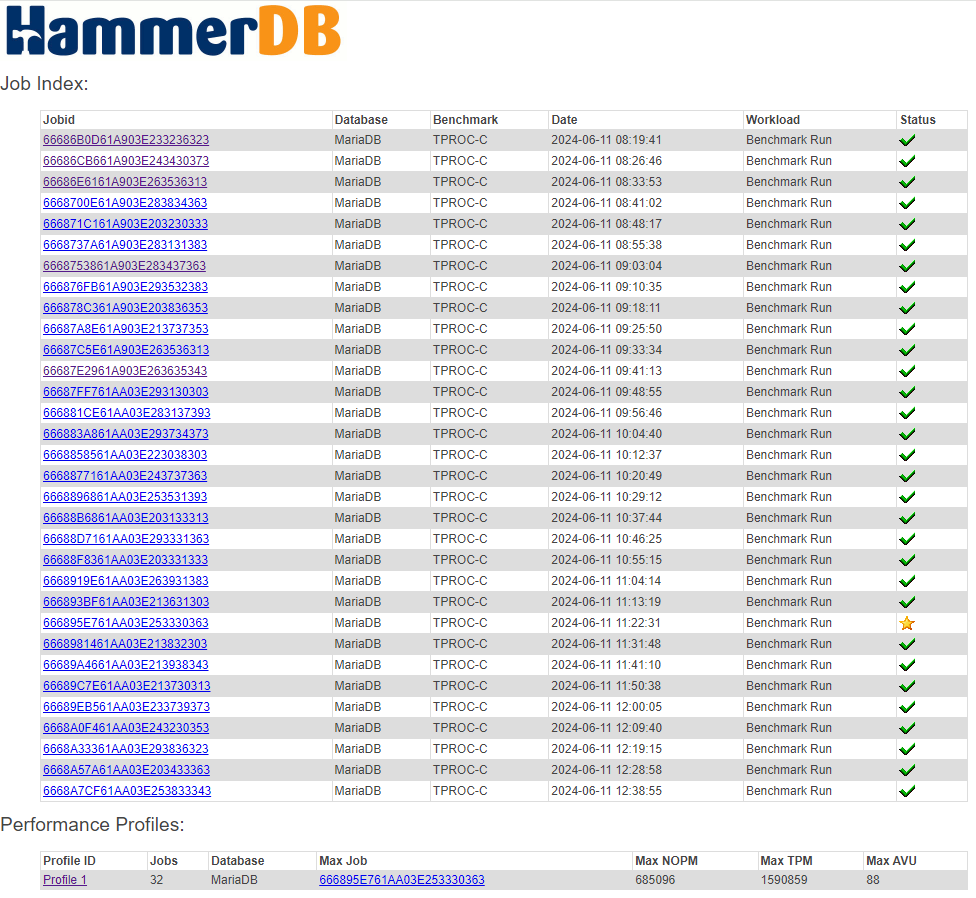
Running the webservice will then show the performance profile

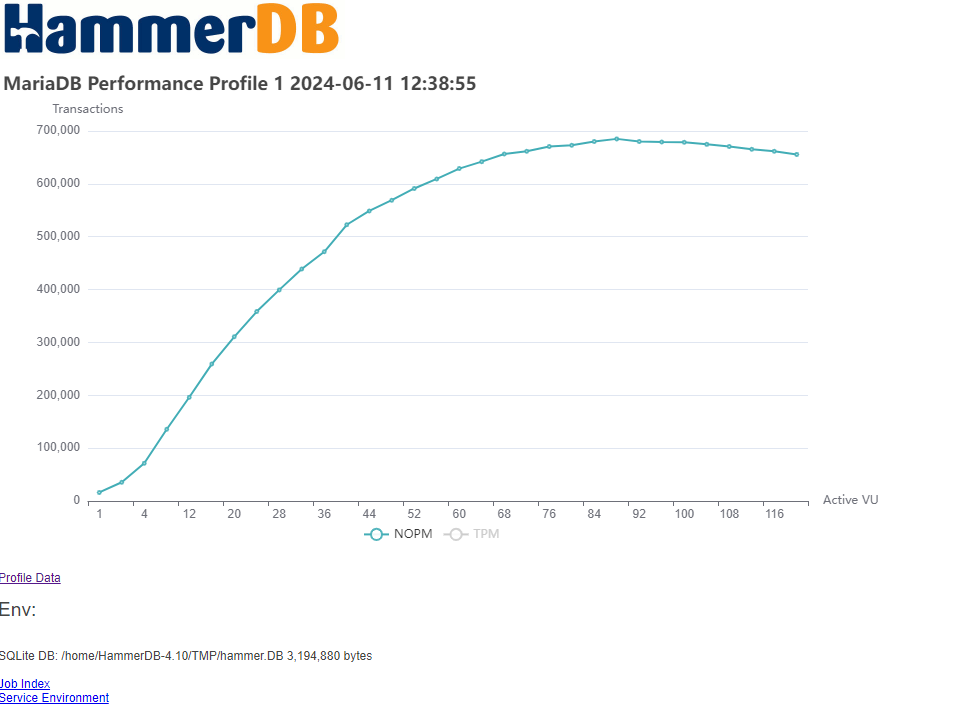
and clicking on the Profile ID the graph of the NOPM and TPM for all of the jobs under that ID.

The CLI also adds a jobs profile command that will report the results of jobs with the profile ID specified.

hammerdb>job profile 1
{
"66686B0D61A903E233236323": {
"db": "MariaDB",
"bm": "TPC-C",
"tstamp": "2024-06-11 08:19:41",
"activevu": "1",
"nopm": "16254",
"tpm": "37709"
},
"66686CB661A903E243430373": {
"db": "MariaDB",
"bm": "TPC-C",
"tstamp": "2024-06-11 08:26:46",
"activevu": "2",
"nopm": "35434",
"tpm": "82497"
},
"66686E6161A903E263536313": {
"db": "MariaDB",
"bm": "TPC-C",
"tstamp": "2024-06-11 08:33:53",
"activevu": "4",
"nopm": "71549",
"tpm": "166405"
},
"6668700E61A903E283834363": {
"db": "MariaDB",
"bm": "TPC-C",
"tstamp": "2024-06-11 08:41:02",
"activevu": "8",
"nopm": "135774",
"tpm": "316012"
},
"666871C161A903E203230333": {
"db": "MariaDB",
"bm": "TPC-C",
"tstamp": "2024-06-11 08:48:17",
"activevu": "12",
"nopm": "196216",
"tpm": "455867"
},
"6668737A61A903E283131383": {
"db": "MariaDB",
"bm": "TPC-C",
"tstamp": "2024-06-11 08:55:38",
"activevu": "16",
"nopm": "258999",
"tpm": "601697"
},
"6668753861A903E283437363": {
"db": "MariaDB",
"bm": "TPC-C",
"tstamp": "2024-06-11 09:03:04",
"activevu": "20",
"nopm": "310608",
"tpm": "721658"
},
"666876FB61A903E293532383": {
"db": "MariaDB",
"bm": "TPC-C",
"tstamp": "2024-06-11 09:10:35",
"activevu": "24",
"nopm": "358359",
"tpm": "832467"
},
"666878C361A903E203836353": {
"db": "MariaDB",
"bm": "TPC-C",
"tstamp": "2024-06-11 09:18:11",
"activevu": "28",
"nopm": "399416",
"tpm": "928993"
},
"66687A8E61A903E213737353": {
"db": "MariaDB",
"bm": "TPC-C",
"tstamp": "2024-06-11 09:25:50",
"activevu": "32",
"nopm": "438920",
"tpm": "1018825"
},
"66687C5E61A903E263536313": {
"db": "MariaDB",
"bm": "TPC-C",
"tstamp": "2024-06-11 09:33:34",
"activevu": "36",
"nopm": "471456",
"tpm": "1095396"
},
"66687E2961A903E263635343": {
"db": "MariaDB",
"bm": "TPC-C",
"tstamp": "2024-06-11 09:41:13",
"activevu": "40",
"nopm": "522600",
"tpm": "1213621"
},
"66687FF761AA03E293130303": {
"db": "MariaDB",
"bm": "TPC-C",
"tstamp": "2024-06-11 09:48:55",
"activevu": "44",
"nopm": "548843",
"tpm": "1275641"
},
"666881CE61AA03E283137393": {
"db": "MariaDB",
"bm": "TPC-C",
"tstamp": "2024-06-11 09:56:46",
"activevu": "48",
"nopm": "569173",
"tpm": "1322266"
},
"666883A861AA03E293734373": {
"db": "MariaDB",
"bm": "TPC-C",
"tstamp": "2024-06-11 10:04:40",
"activevu": "52",
"nopm": "591268",
"tpm": "1373413"
},
"6668858561AA03E223038303": {
"db": "MariaDB",
"bm": "TPC-C",
"tstamp": "2024-06-11 10:12:37",
"activevu": "56",
"nopm": "609316",
"tpm": "1415349"
},
"6668877161AA03E243737363": {
"db": "MariaDB",
"bm": "TPC-C",
"tstamp": "2024-06-11 10:20:49",
"activevu": "60",
"nopm": "628853",
"tpm": "1462056"
},
"6668896861AA03E253531393": {
"db": "MariaDB",
"bm": "TPC-C",
"tstamp": "2024-06-11 10:29:12",
"activevu": "64",
"nopm": "642036",
"tpm": "1491259"
},
"66688B6861AA03E203133313": {
"db": "MariaDB",
"bm": "TPC-C",
"tstamp": "2024-06-11 10:37:44",
"activevu": "68",
"nopm": "656450",
"tpm": "1524772"
},
"66688D7161AA03E293331363": {
"db": "MariaDB",
"bm": "TPC-C",
"tstamp": "2024-06-11 10:46:25",
"activevu": "72",
"nopm": "661515",
"tpm": "1536318"
},
"66688F8361AA03E203331333": {
"db": "MariaDB",
"bm": "TPC-C",
"tstamp": "2024-06-11 10:55:15",
"activevu": "76",
"nopm": "670828",
"tpm": "1557467"
},
"6668919E61AA03E263931383": {
"db": "MariaDB",
"bm": "TPC-C",
"tstamp": "2024-06-11 11:04:14",
"activevu": "80",
"nopm": "672855",
"tpm": "1563938"
},
"666893BF61AA03E213631303": {
"db": "MariaDB",
"bm": "TPC-C",
"tstamp": "2024-06-11 11:13:19",
"activevu": "84",
"nopm": "680334",
"tpm": "1580944"
},
"666895E761AA03E253330363": {
"db": "MariaDB",
"bm": "TPC-C",
"tstamp": "2024-06-11 11:22:31",
"activevu": "88",
"nopm": "685096",
"tpm": "1590859"
},
"6668981461AA03E213832303": {
"db": "MariaDB",
"bm": "TPC-C",
"tstamp": "2024-06-11 11:31:48",
"activevu": "92",
"nopm": "680334",
"tpm": "1580664"
},
"66689A4661AA03E213938343": {
"db": "MariaDB",
"bm": "TPC-C",
"tstamp": "2024-06-11 11:41:10",
"activevu": "96",
"nopm": "679016",
"tpm": "1577343"
},
"66689C7E61AA03E213730313": {
"db": "MariaDB",
"bm": "TPC-C",
"tstamp": "2024-06-11 11:50:38",
"activevu": "100",
"nopm": "678694",
"tpm": "1577827"
},
"66689EB561AA03E233739373": {
"db": "MariaDB",
"bm": "TPC-C",
"tstamp": "2024-06-11 12:00:05",
"activevu": "104",
"nopm": "674706",
"tpm": "1566707"
},
"6668A0F461AA03E243230353": {
"db": "MariaDB",
"bm": "TPC-C",
"tstamp": "2024-06-11 12:09:40",
"activevu": "108",
"nopm": "670643",
"tpm": "1557979"
},
"6668A33361AA03E293836323": {
"db": "MariaDB",
"bm": "TPC-C",
"tstamp": "2024-06-11 12:19:15",
"activevu": "112",
"nopm": "665293",
"tpm": "1545308"
},
"6668A57A61AA03E203433363": {
"db": "MariaDB",
"bm": "TPC-C",
"tstamp": "2024-06-11 12:28:58",
"activevu": "116",
"nopm": "661495",
"tpm": "1536360"
},
"6668A7CF61AA03E253833343": {
"db": "MariaDB",
"bm": "TPC-C",
"tstamp": "2024-06-11 12:38:55",
"activevu": "120",
"nopm": "655745",
"tpm": "1523566"
}
}

Performance Profiles Summary

With the new performance profile, functionality HammerDB enables you to group related TPROC-C jobs under an ID and use it to compare performance across benchmarks at different levels of utilisation and different configurations.

The profile ID chart will show performance for each individual profile.

And you can then quickly pinpoint specific jobs and drill down into their performance characteristics.

If you are not already building performance profiles manually, then this functionality makes it easier than ever to fully analyze your database performance.


HammerDB v4.10 New Features: Partitioning and Advanced Statistics for SQL Server TPROC-H


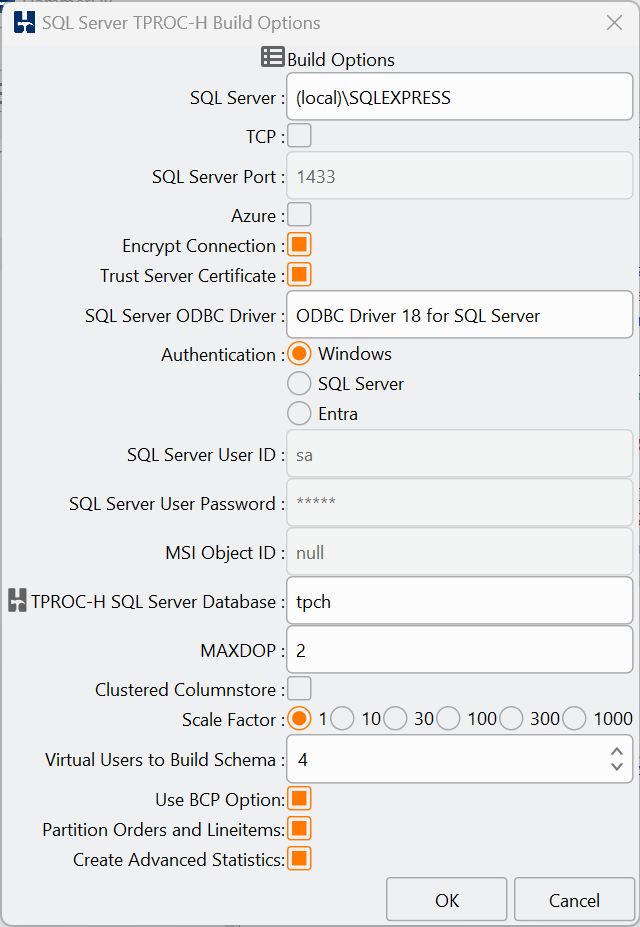
HammerDB v4.10 adds performance enhancements for the SQL Server TPROC-H workload in the form of partitioning for the orders and lineitem tables as well as the option to create advanced statistics.

Enabling Partitioning and Advanced Statistics

These can be selected with a checkbox in the GUI.

or the following options being set to true in the CLI.

mssqls_tpch_partition_orders_and_lineitems = true
mssqls_tpch_advanced_stats = true

Benefits of Partitioning and Advanced Statistics

When partitioning is selected both the order and Lineitem tables are partitioned with each partition spanning 1 week. By default t partition flag is set to false by default and must be enabled. Both Column Store and Row store are allowed to be partitioned. When partioning is enabled. Certain primary and foreign key definitions defined in HammerDB are no longer valid and will not be created. However HammerDB will still create those keys/constraints when the Orders and Lineitem tables are not partitioned.`

For columnstore indices, the is an initial degradation of performance, however if the user calls Alter Index … Reorganize or leaves the server running after the initial load for approximately 48 hours, the performance of power runs improves by 2X when compared to column store indices with no partitioning.

The advanced statistics option is also set to off by default, and when enabled it does increase the overall load time however it creates an option for users loading TPCH for MSSQL to perform a more advanced statistical analysis to benefit query performance.

Summary

HammerDB v4.10 introduces an option to partition the SQL Server TPROC-H schema and perform a more advanced statistical analysis, taking advantage of these options can benefit query performance.


HammerDB v4.10 New Features: Schema and Consistency Checks

The HammerDB TPROC-C and TPROC-H workloads are derived from the TPC-C and TPC-H workloads respectively.  Although the HammerDB workloads are not identical to TPC-C and TPC-H it is still important that the workloads implemented maintain the same data consistency as the official workloads. For this reason HammerDB has implemented the data consistency checks for TPC-C and TPC-H to be run against all databases.

The consistency checks are useful to be run after a schema build but also after a workload has been run to ensure that the data has remained consistent throughout all of the changes implemented by the workload.  As the consistency checks are the same ones stipulated by the TPC specification you are also welcome to run them against tests run against clustered and distributed environments and any workloads claimed to be derived from TPC workloads. The checks ensure that your transactions are fully and correctly processed by your database.

In addition to the consistency checks, HammerDB has also added a number of schema checks to ensure that the a schema build has completed successfully and the database is fully populated with the correct stored procedures.

Running the TPROC-C Schema and Consistency Check

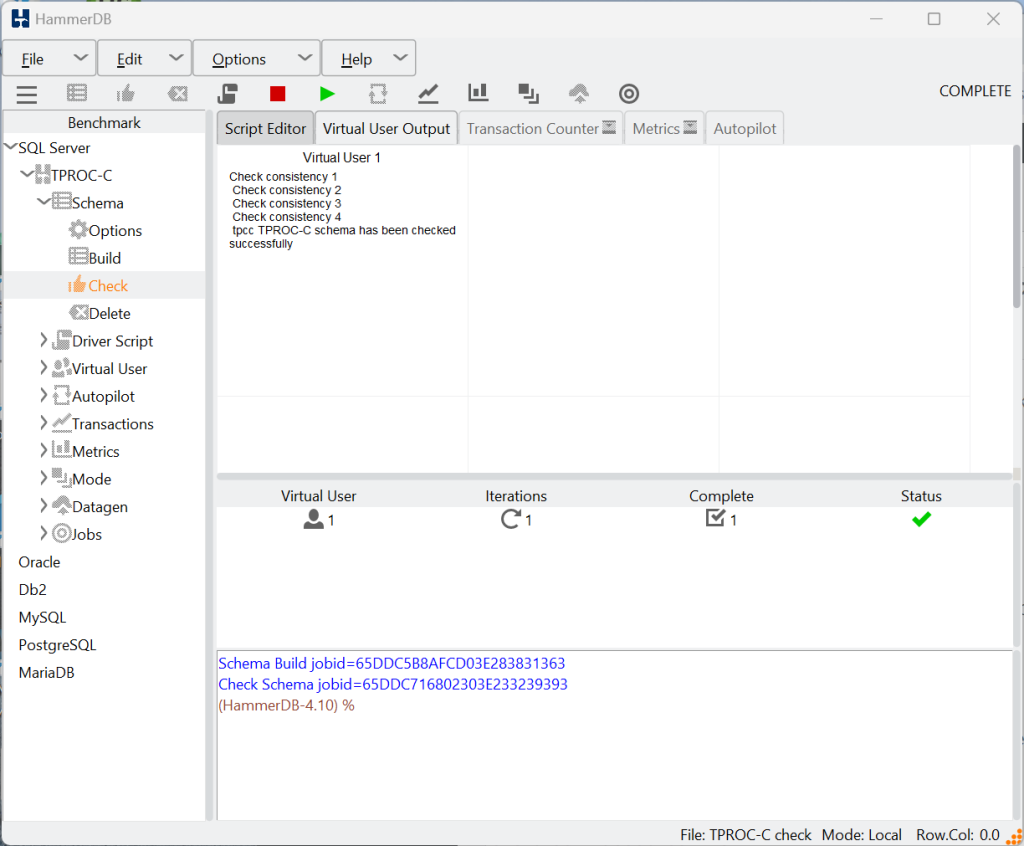
To run the schema check, firstly build your schema and let it complete.

Then select the Check option from the main menu or treeview, accept the dialog prompt and let it run through the checks.  With the CLI run the checkschema command. Note that on some databases row counts may take longer than others and the test may take a number of minutes to complete.  The first part of the schema checks are particularly relevant after the build and it will check.

  1. Database Exists.
  2. Tables Exist.
  3. Warehouse count in schema is the same as the HammerDB configuration.
  4. Tables are indexed.
  5. Tables are populated.
  6. Stored Procedures Exist.

It will also run the consistency checks that we will cover after the workload has completed.

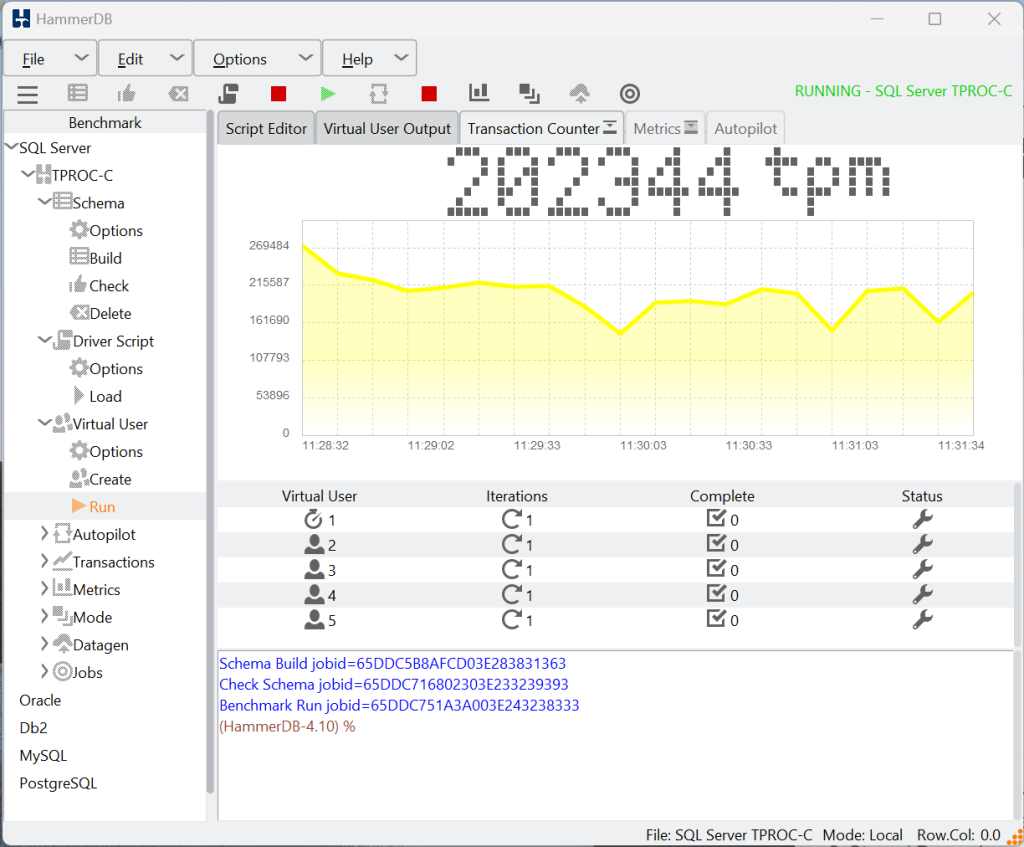
After the initial check, run the workload.

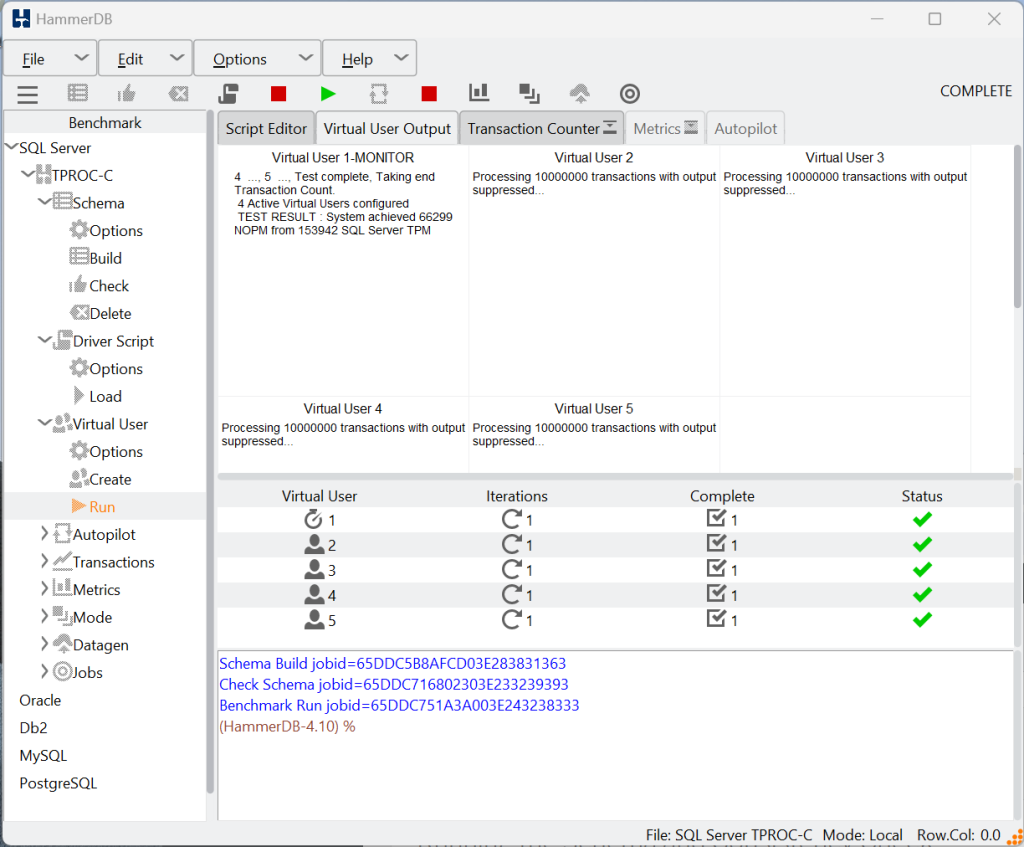
Let the workload run to completion.

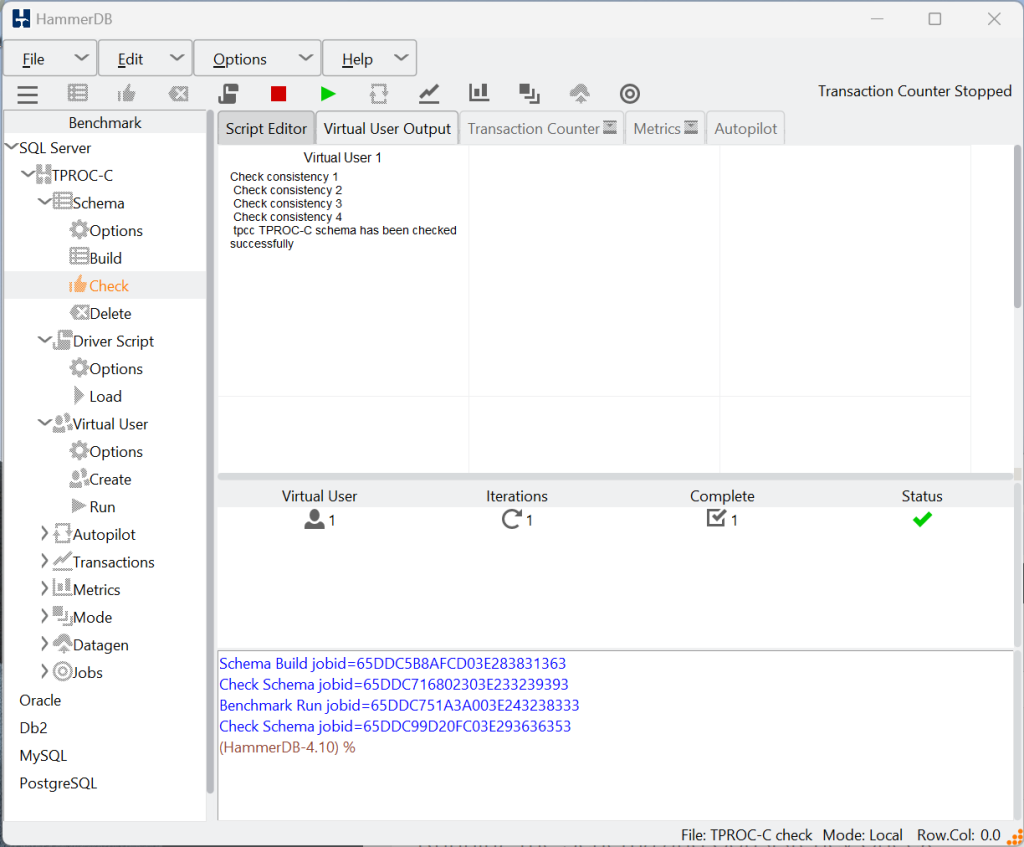
You can then re-run the schema and consistency checks.

After you have run a workload the consistency checks are the most important aspect although the schema checks provide benefit especially in checking the row populations. With the consistency checks, HammerDB will create a temporary table with a sample of warehouse ids and then run the following checks.

  1. For each District within a Warehouse, the next available Order ID (d_next_o_id) minus one is equal to the most recent Order ID [max(o_id)] for the ORDER table associated with the preceding District and Warehouse. Additionally, that same relationship exists for the most recent Order ID [max(o_id)] for the NEW-ORDER table associated with the same District and Warehouse. Those relationships can be illustrated as: d_next_o_id – 1 = max(o_id) = max(no_o_id) where (d_w_id = o_w_id = no_w_id) and (d_id = o_d_id = no_d_id)
  2. For each District within a Warehouse, the value of the most recent Order ID [max(no_o_id)] minus the first Order ID [min(no_o_id)] plus one, for the NEW-ORDER table associated with the District and Warehouse, equals the number of rows in that NEW-ORDER table. That relationship can be illustrated as: max(no_o_id) – min(no_o_id) + 1 = rows in NEW-ORDER where (o_w_id = no_w_id) and (o_d_id = no_d_id)
  3. For each District within a Warehouse, the sum of Order-Line counts [sum(o_ol_cnt)] for the Orders associated with the District equals the number of rows in the ORDER-LINE table associated with the same District. That relationship can be illustrated as: sum(o_ol_cnt) = rows in the ORDER-LINE table for the Warehouse and District
  4. The sum of balances (d_ytd) for all Districts within a specific Warehouse is equal to the balance (w_ytd) of that Warehouse.

If completed successfully the check ensures that your data has remained consistent after the workload has completed.

Running the TPROC-H Schema and Consistency Check

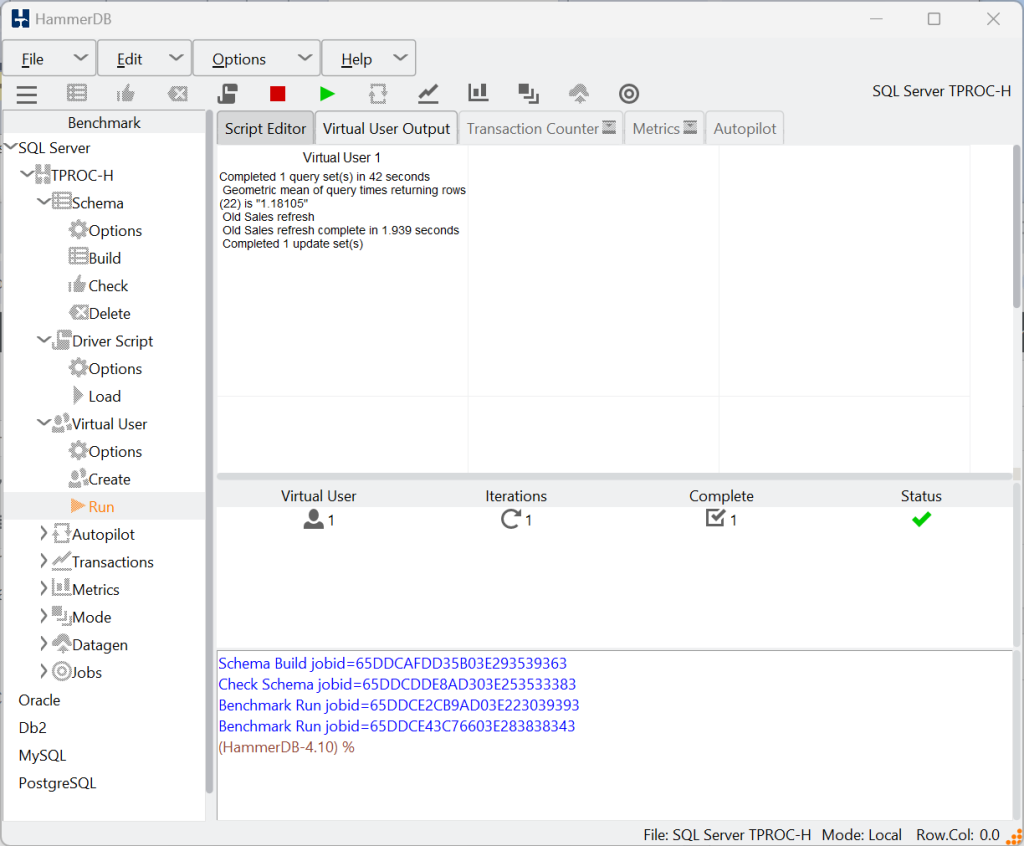
The schema and consistency checks for the TPROC-H as expected follow a similar approach to TPROC-C and you can run the check after the build to ensure that the build completed successfully. If you only run the query aspect of the TPROC-H workload the data is unmodified and therefore there will not be benefit from running the schema and consistency checks again after you have verified the initial build. However the refresh function does modify the data and therefore if you run a refresh function then you can run the check to verify the consistency. In the example below we have used one virtual user to run the power test which runs the new sales order refresh, one query set and the old sales refresh.

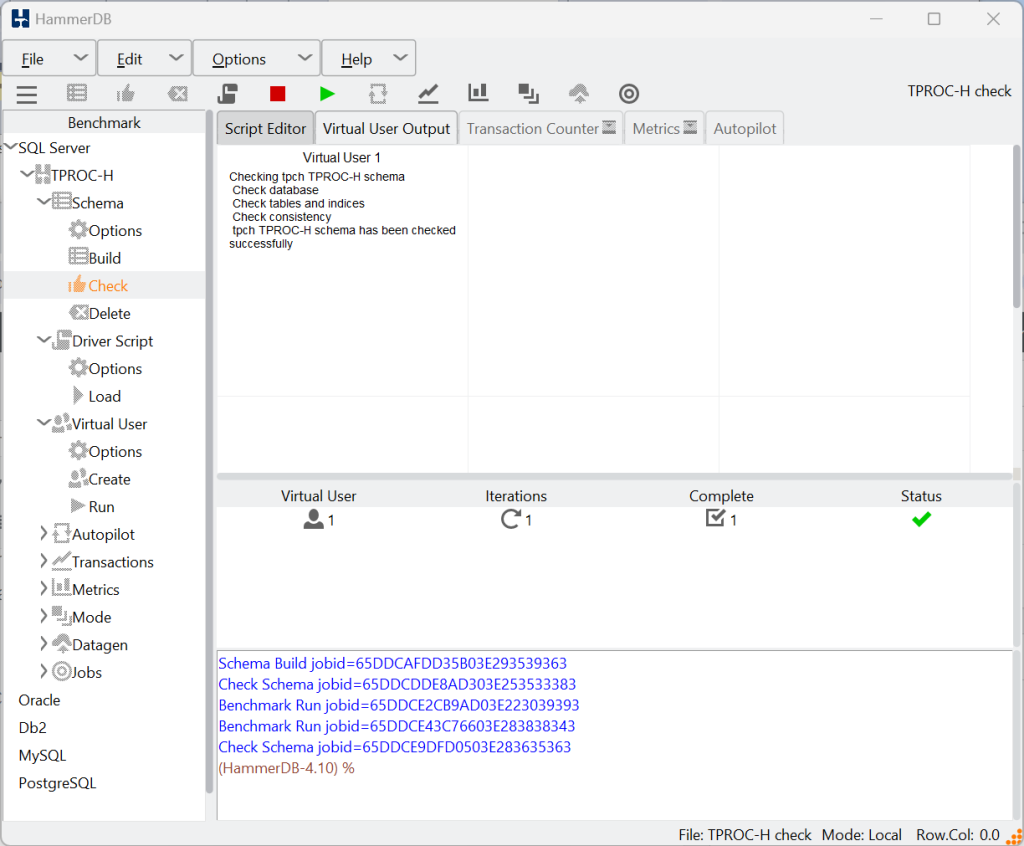
After this test running the refresh function and query workload run the schema and consistency check to verify the refresh function has not impacted the data consistency.


The TPROC-H schema and consistency checks run the following checks:

  1. Database Exists.
  2. Tables Exist.
  3. Scale Factor in schema is the same as the HammerDB configuration.
  4. Tables are indexed.
  5. Tables are populated.
  6. Consistency Check.
    1. A consistent state for the TPC-H database is defined to exist when: O_TOTALPRICE = SUM(L_EXTENDEDPRICE*(1-L_DISCOUNT)(1+L_TAX) for each ORDER and LINEITEM defined by (O_ORDERKEY=L_ORDERKEY) and can be checked by: SELECT DECIMAL(SUM(DECIMAL(INTEGER(INTEGER(DECIMAL (INTEGER(100DECIMAL(L_EXTENDEDPRICE,20,3)),20,3)* (1-L_DISCOUNT)) * (1+L_TAX)),20,3)/100.0),20,3) FROM LINEITEM WHERE L_ORDERKEY = okey SELECT DECIMAL(SUM(O_TOTALPRICE, 20, 3)) from ORDERS WHERE O_ORDERKEY = okey

    Summary

    HammerDB v4.10 introduces schema and data consistency checks for all databases and workloads to enable you to verify the schema has been built correctly and that the data remains consistent before and after running workloads.