
In a recent project comparing systems for MariaDB performance, a user had originally been using a tool called sysbench-tpcc to compare hardware platforms before migrating to HammerDB. However, the user was not aware that the performance could be compared between the 2. This is a brief post to highlight the metrics to use to do the comparison using a separate hardware platform for illustration purposes.
Firstly, it is worth noting that both HammerDB TPROC-C and sysbench-tpcc run workloads based on the TPC-C specification, however as described here HammerDB is called TPROC-C to correctly comply with the TPC fair use rules.
Also note that whereas HammerDB offers a feature to do a fixed throughput workload close to the specification. In this case, we will only show the workloads run without keying and thinking time, as only HammerDB offers both. HammerDB also runs natively on Windows and Linux with GUI, CLI and Web interfaces on multiple databases, but in this case the example will be on MariaDB on Linux with the CLI.
Prepare or build the schema
Firstly, before running a workload, you need to build or prepare the schema. sysbench-tpcc offers the ability to build multiple schemas to work around scalability issues, however the TPC-C specification uses a single set of tables which can be built as follows.
./tpcc.lua --mysql-socket=/tmp/mariadb.sock --mysql-user=root --mysql-password=maria --mysql-db=tpccsb --time=300 --threads=64 --report-interval=1 --tables=1 --scale=400 --db-driver=mysql prepare
The equivalent in HammerDB is the buildschema command, with example settings as below. The scripts can be in Python or Tcl format.
#!/bin/tclsh
# maintainer: Pooja Jain

puts "SETTING CONFIGURATION"
dbset db maria
dbset bm TPC-C

diset connection maria_host localhost
diset connection maria_port 3306
diset connection maria_socket /tmp/mariadb.sock

set vu 100
set warehouse 400
diset tpcc maria_count_ware $warehouse
diset tpcc maria_num_vu $vu
diset tpcc maria_user root
diset tpcc maria_pass maria
diset tpcc maria_dbase tpcc
diset tpcc maria_storage_engine innodb
if { $warehouse >= 200 } {
diset tpcc maria_partition true
} else {
diset tpcc maria_partition false
}
puts "SCHEMA BUILD STARTED"
buildschema
puts "SCHEMA BUILD COMPLETED"
and run as follows from the command line.
./hammerdbcli auto ./scripts/tcl/maria/tprocc/maria_tprocc_build.tcl
You can see that both schemas are similar when built, with the main difference being that sysbench adds prefixes to a number of columns to aid with compression whereas HammerDB is closer to the specification.
MariaDB [tpccsb]> show tables;
+------------------+
| Tables_in_tpccsb |
+------------------+
| customer1        |
| district1        |
| history1         |
| item1            |
| new_orders1      |
| order_line1      |
| orders1          |
| stock1           |
| warehouse1       |
+------------------+
9 rows in set (0.000 sec)

MariaDB [tpccsb]> select * from warehouse1 limit 1;
+------+------------+--------------------+--------------------+-----------------+---------+-----------+-------+------------+
| w_id | w_name     | w_street_1         | w_street_2         | w_city          | w_state | w_zip     | w_tax | w_ytd      |
+------+------------+--------------------+--------------------+-----------------+---------+-----------+-------+------------+
|    1 | name-ussgn | street1-suwfdxnitk | street2-sdptwkrcjd | city-wowgpzhpmq | fu      | zip-12460 |  0.12 | 8398416.00 |
+------+------------+--------------------+--------------------+-----------------+---------+-----------+-------+------------+

MariaDB [tpcc]> show tables;
+----------------+
| Tables_in_tpcc |
+----------------+
| customer       |
| district       |
| history        |
| item           |
| new_order      |
| order_line     |
| orders         |
| stock          |
| warehouse      |
+----------------+
9 rows in set (0.000 sec)

MariaDB [tpcc]> select * from warehouse limit 1;
+------+-----------+--------+----------+---------------+---------------------+--------------------+---------+-----------+
| w_id | w_ytd     | w_tax  | w_name   | w_street_1    | w_street_2          | w_city             | w_state | w_zip     |
+------+-----------+--------+----------+---------------+---------------------+--------------------+---------+-----------+
|    1 | 300000.00 | 0.1800 | kyKhVJqn | ukYR4HaaEJLVi | icFhnjwgqE3cexTJFwR | Kxf1T7pcaHNyvELEIx | lH      | 358511111 |
+------+-----------+--------+----------+---------------+---------------------+--------------------+---------+-----------+
Running the workloads
We can run the workloads as follows, and in the example on both we will use 80 threads or Virtual Users in HammerDB terminology. To run the workload on sysbench-tpcc is the following.
./tpcc.lua --mysql-socket=/tmp/mariadb.sock --mysql-user=root --mysql-password=maria --mysql-db=tpccsb --time=300 --threads=80 --report-interval=1 --tables=1 --scale=400 --db-driver=mysql run
As the workloads are based on the same specification, you can use HammerDB to monitor the sysbench-tpcc workload with the metstart command starting the CPU monitor and tcstart the transaction counter.
hammerdb>metstart
Starting Local Metrics Agent on ubuntu
after#1
hammerdb>Connecting to Agent to Display CPU Metrics
Metric receive port open @ 27702 on ubuntu
Connecting to HammerDB Agent @ localhost:10000
Testing Agent Connectivity...OK
Metrics Connected
Started CPU Metrics for Intel(R) Xeon(R) Platinum 8280L CPU @ 2.70GHz:(112 CPUs)
hammerdb>tcstart
Transaction Counter Started

hammerdb>0 MariaDB tpm
CPU all usr%-0.00 sys%-0.02 irq%-0.00 idle%-99.97
0 MariaDB tpm
and a HammerDB example script as follows:
#!/bin/tclsh
# maintainer: Pooja Jain

set tmpdir $::env(TMP)
puts "SETTING CONFIGURATION"
jobs profileid 0
dbset db maria
dbset bm TPC-C
giset timeprofile xt_gather_timeout 1200
giset commandline keepalive_margin 1200

diset connection maria_host 127.0.0.1
diset connection maria_port 3306
diset connection maria_socket /tmp/mariadb.sock
#
diset tpcc maria_user root
diset tpcc maria_pass maria
diset tpcc maria_dbase tpcc
diset tpcc maria_driver timed
diset tpcc maria_rampup 2
diset tpcc maria_duration 5
diset tpcc maria_no_stored_procs false
diset tpcc maria_allwarehouse false
diset tpcc maria_timeprofile true
diset tpcc maria_purge true
#start CPU
metstart
puts "TEST STARTED"
loadscript
vuset vu 80
vuset logtotemp 1
vucreate
tcstart
tcstatus
vurun
tcstop
vudestroy
#stop CPU
metstop
puts "TEST COMPLETE"
Note that a key parameter here is setting maria_no_stored_procs to true or false. HammerDB uses stored procedures for higher throughput as fully explained here, but also offers a client SQL based version for comparison, sysbench implements a client SQL based version and therefore this is a key understanding for the difference between the 2 workloads. The HammerDB workload is run as shown:
./hammerdbcli auto ./scripts/tcl/maria/tprocc/maria_tprocc_run.tcl
Comparing the results
When running the 80 thread sysbench-tpcc workload, monitoring with HammerDB we can see the following output.
hammerdb>0 MariaDB tpm
CPU all usr%-17.58 sys%-4.18 irq%-0.00 idle%-78.21
485784 MariaDB tpm
CPU all usr%-17.87 sys%-4.30 irq%-0.00 idle%-77.80
497376 MariaDB tpm
CPU all usr%-17.79 sys%-4.36 irq%-0.00 idle%-77.84
478644 MariaDB tpm
CPU all usr%-17.74 sys%-4.35 irq%-0.00 idle%-77.88
485718 MariaDB tpm
and when it has finshed it prints output as follows:
SQL statistics:
    queries performed:
        read:                            31779084
        write:                           32983004
        other:                           4898362
        total:                           69660450
    transactions:                        2449061 (8162.57 per sec.)
    queries:                             69660450 (232173.91 per sec.)
    ignored errors:                      10685  (35.61 per sec.)
    reconnects:                          0      (0.00 per sec.)

Throughput:
    events/s (eps):                      8162.5668
    time elapsed:                        300.0356s
    total number of events:              2449061

Latency (ms):
         min:                                    0.35
         avg:                                    9.80
         max:                                  307.66
         95th percentile:                       41.10
         sum:                             23997083.58

Threads fairness:
    events (avg/stddev):           30613.2625/297.35
    execution time (avg/stddev):   299.9635/0.01
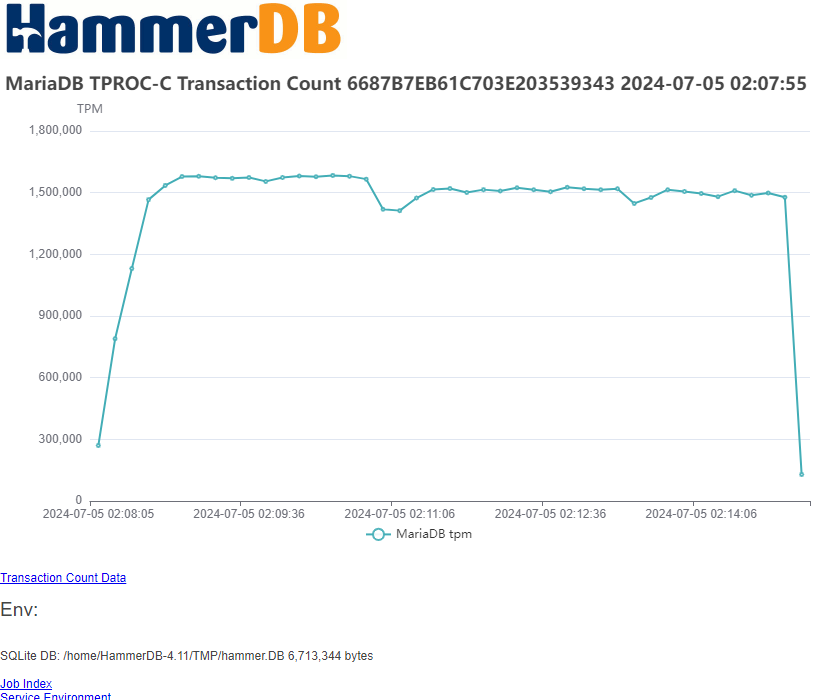
The key figure here is 8162.57 per sec, multiplied by 60 gives us 489,754 TPM (transactions per minute) and is the figure we can use for comparison as can be seen from the HammerDB transaction output giving the same data.
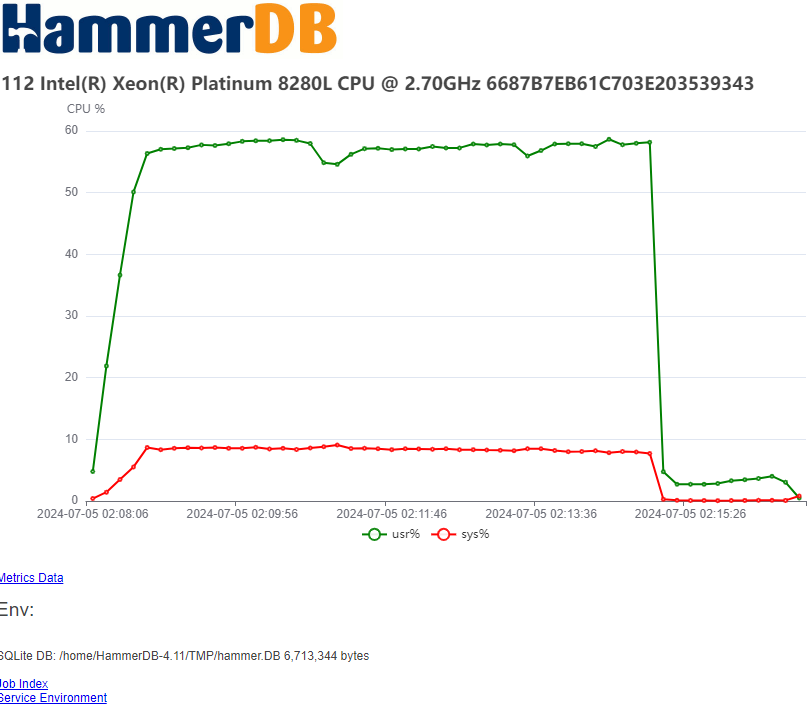
Running HammerDB with stored procedures we can see the difference in CPU utilisation and transactions.
CPU all usr%-52.76 sys%-6.52 irq%-0.00 idle%-40.52
1512462 MariaDB tpm
CPU all usr%-52.85 sys%-6.43 irq%-0.00 idle%-40.55
1519824 MariaDB tpm
CPU all usr%-53.01 sys%-6.47 irq%-0.00 idle%-40.35
1515888 MariaDB tpm
CPU all usr%-52.99 sys%-6.36 irq%-0.00 idle%-40.51
1524312 MariaDB tpm
and it is the TPM value that we use for comparison and not NOPM, as both tools are measuring transactions per second/minute.
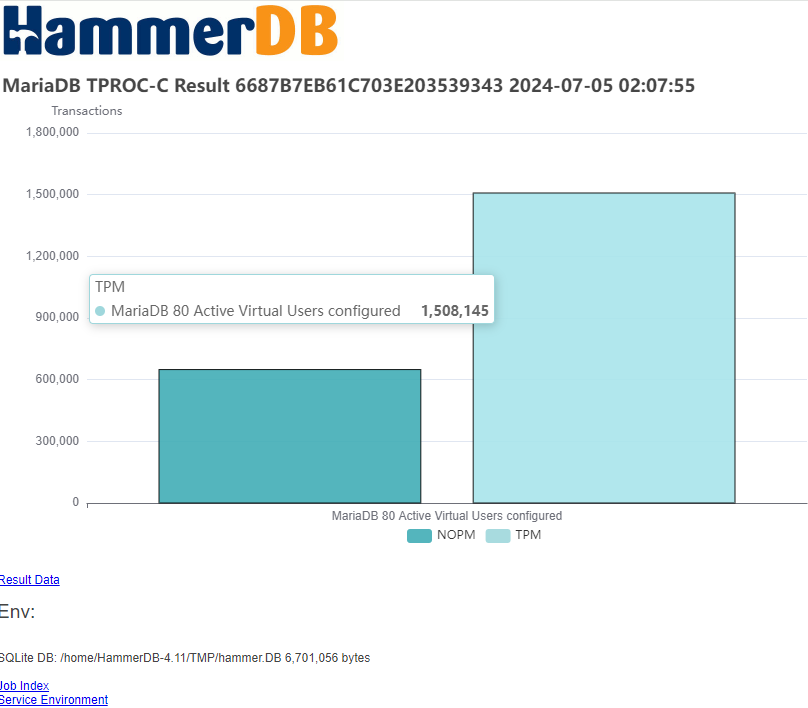
Vuser 1:80 Active Virtual Users configured
Vuser 1:TEST RESULT : System achieved 632885 NOPM from 1471425 MariaDB TPM
if we use the HammerDB no stored procedures option we can see that performance drops as would be expected.
Vuser 1:Test complete, Taking end Transaction Count.
Vuser 1:80 Active Virtual Users configured
Vuser 1:TEST RESULT : System achieved 491964 NOPM from 1143635 MariaDB TPM
and refering to the previous article we can see that we are using more system time as we are now spending more time in the network.
1155714 MariaDB tpm
CPU all usr%-52.57 sys%-11.44 irq%-0.00 idle%-35.90
1163382 MariaDB tpm
CPU all usr%-52.73 sys%-11.57 irq%-0.00 idle%-35.61
1154976 MariaDB tpm
CPU all usr%-52.60 sys%-11.71 irq%-0.00 idle%-35.60
1153836 MariaDB tpm
CPU all usr%-52.56 sys%-11.67 irq%-0.00 idle%-35.68
Analyzing results
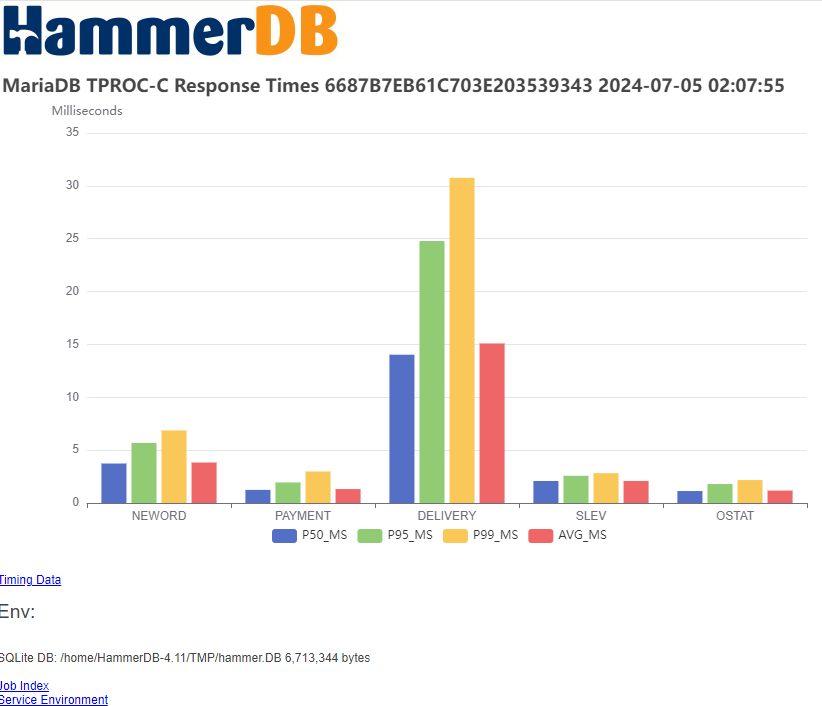
HammerDB will also automatically generate graphs for you to analyze your workload and detailed response times per transaction.
Summary
Of course the more benchmarks and workloads you run against a system, the more insights you can get. All benchmarks are valuable, however it is important to ensure that you deriving accurate results.
In our example a user was initially using sysbench-tpcc to compare different hardware systems for MariaDB however was drawing conclusions about both the hardware and database software capabilities that was not in keeping with our observations. Using this approach we provided an alternative measurement and showed how both approaches compared to illustrate the capabilities of both the hardware and software.