With the move to HammerDB v3.0 as well as refactoring a lot of code the documentation moved to Docbook format. Previously at v2 there was an Oracle best practice document that is no longer included in the current documentation although a number of people have asked for it. Nevertheless lot of this information remains relevant to HammerDB v3.0 and v3.1 including gathering a number of links to older blog posts focusing on specific areas such as CPU, Memory and I/O. Working through this base configuration information can give a significant head start in configuring an Oracle Database to get the best results from HammerDB. As an Intel employee (#IAMINTEL) the examples are taken from Oracle on Linux on Intel although the approach is the same for whatever system you are testing.
CPU, Memory and I/O
The key dependence of performance is hardware related with the CPU being the most important factor on the levels of performance available from the rest of the system. At the next level from the CPU is memory with the best levels of performance available from having sufficient memory to cache all of the test database. Finally I/O performance is crucial with modern systems and CPUs available to drive high levels of throughput, In particular for OLTP workloads write performance to transaction logs is critical and often a major resource constraint. Solid State Disks (SSDs) are strongly recommended for both data areas and redo logs to provide the I/O capabilities to match the CPU performance of up to date systems.
BIOS Settings
Systems are shipped with default BIOS and are not necessarily optimized for database performance. BIOS settings should be checked and settings verified with the vendor to ensure that they are advantageous to Oracle Performance. A common error is to accept a default setting of “High Performance” that sets a subset of lower level BIOS settings without verifying what these are. A default setting of “High Performance” will often result in lower performance for a database environment.
Power Saving
Modern CPUs and systems running Linux are designed to offer high levels performance whilst incorporating power saving features such as Turbo Boost and C-state and P-state management. Firstly you should ensure that your version of Linux paying particular attention to the kernel version is compatible with the CPU in your system. You should not assume full compatibility until verified. Once you have done this check the features of your CPU model and verify your configuration of the scaling governor and energy performance bias with tools such as PowerTop and turbostat. Full details on how to do this are provided in the blog post How to Maximise CPU Performance for the Oracle Database on Linux.
Verify Single Threaded Performance
Once you have set your BIOS settings and Power Saving settings verify that you achieve maximum CPU single threaded performance by creating and running the following stored procedure:
SET SERVEROUTPUT ON
SET TIMING ON
DECLARE
n NUMBER := 0;
BEGIN
FOR f IN 1..10000000
LOOP
n := MOD (n,999999) + SQRT (f);
END LOOP;
DBMS_OUTPUT.PUT_LINE ('Res = '||TO_CHAR (n,'999999.99'));
END;
/
More details on running this test are here Testing C-State Settings and Performance with the Oracle Database on Linux. The test will produce a result such as follows where the elapsed time is important.
Res = 873729.72
PL/SQL procedure successfully completed.
Elapsed: 00:00:07.88
Results will vary according to CPU model however typically a modern CPU will complete this test in 10 seconds or less according to configuration ensuring both system and Linux power saving settings are set optimally for Oracle performance.
Hyper-Threading
Previously you will have determined your CPU features. One CPU feature that may be available is Hyper-Threading. If this feature is available it should be enabled and under a correctly configured system will result in a performance gain. Details on the benefits of Hyper-Threading are available here Hyper-Threading On or Off for Oracle?
Memory
Correctly configuring memory is essential to Oracle performance. On Linux you should ensure that you have your Oracle memory correctly configured for Huge Pages (Not transparenthuge pages). Follow the guide detailed here to ensure that your memory is correctly configured. Configuring Memory for Oracle on Linux
I/O and SSDs
After correctly configuring memory your focus should be on I/O or disk performance. This focus lies in 2 areas firstly the data area defined by the tablespace or tablespaces you create to configure your schema and secondly the redo logs. For both data and redo the best performance available is from good quality and correctly configured SSDs (solid state disks). Further information on SSDs is available in the post Should you put Oracle Database Redo on Solid State Disks (SSDs)?. Configuring the data area should be done in conjunction with configuring memory for the buffer cache. With sufficient memory you can expect most of your data blocks to be cached and therefore interaction with the data area until a checkpoint occurs may be minimal. On the other hand an OLTP workload will continually write to the redo log file and throughput should be high and latency low (< 1ms) to achieve the highest transaction numbers. With SSDs careful consideration should be given to setup and Linux Database Performance on SSD 910 with Filesystemdetail how this should be done.
Network Bandwidth
Oracle OCI is network efficient and issues should not be found with high throughput even on a typical Gigabit Ethernet network. If system network utilisation does exceed Gigabit capacity between load generation server and SUT to increase capacity you may use either use 10GbE or configure NIC teaming for multiple Gigabit Ethernet adapters on both the server and both the LACP compatible switch in LACP mode.
Oracle Parameters
Your Oracle parameters will vary according to the size and configuration of your system and therefore there is no single recommend Oracle parameter file. Nevertheless standard best practice includes sizing shared memory manually rather than automatically and disabling database features that are not currently in use.
As an example the following white paper shows a configuration file used for a large high performance system Mission-Critical Database Performance: Intel Xeon Processor E7 V2 Family vs. Ibm Power7+.
Database Creation
Building the HammerDB schema directly on the database server will be quicker as you will be able to take advantage of more cores and not be required to pass all of the data across the network. You should already have your database software installed and Oracle running. Before running the schema creation create the tablespace required for your data area. Ensure that this file is suitably large not to autoextend and to allow for sufficient table growth during tests.
Schema Build and Configure
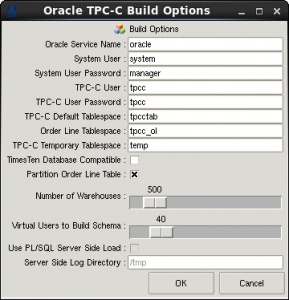
If you select a schema of more than 200 warehouses the option to partition the order line becomes available. When running on larger systems selecting this option will enable high levels of scalability. Additionally there is the option to select a separate order line tablespace from the tablespace where the other tables are located and therefore also to create this tablespace with a separate block size. Previously the Oracle parameter to create a separate cache for this block size will have been chosen. For example:
db_16k_cache_size=32749125632
As the order line tablespace is an IOT (index organized table) for highly scalable systems this will benefit from choosing a larger blocksize for this tablespace such as 16k with a standard blocksize used of 8k. This has the effect of reducing the height of the IOT and lower the number of index block splits resulting in higher performance.
Resize the Redo Log Files
The importance of correctly sizing the redo logs cannot be understated. The sizing of your redo logs is related to checkpointing activity and further details on Oracle checkpoints are described here What’s the Point of Oracle Checkpoints?. When your Oracle database checkpoints it will trigger the database writers to flush the modified data blocks from the buffer cache back to disk. In particular if Oracle needs to wait to reassign a redo log containing changes not yet written to disk a message of “Checkpoint not complete” will be recorded in the alert log and the database will stop processing transaction until it is complete. It is recommended to set the following Oracle parameter to monitor all checkpoint activity in the alert log.
log_checkpoints_to_alert=TRUE
Depending on your I/O capacity this may impact performance. A checkpoint may occur as a result of a redo log switch depending on the contents of that redo log at the time. Recommended redo log file parameters to ensure this behaviour are:
fast_start_mttr_target=0
log_checkpoint_interval=0
log_checkpoint_timeout=0
Nevertheless redo log files (especially from an OLTP test) cannot be sized too large and an effective strategy is to use the data from Oracle to size 2 or more redo log files large enough to delay checkpointing until the end of the test. For example the following extract of a load profile from an AWR report shows a redo rate of 405MB per second.
Load Profile                    Per Second   Per Transaction  Per Exec  Per Call
~~~~~~~~~~~~~~~            ---------------   --------------- --------- ---------
             DB Time(s):               0.0               0.0      0.00      0.00
              DB CPU(s):               0.0               0.0      0.00      0.00
      Redo size (bytes):     405,860,130.7           5,345.2
  Logical read (blocks):       7,892,009.8             103.9
          Block changes:       2,377,433.9              31.3
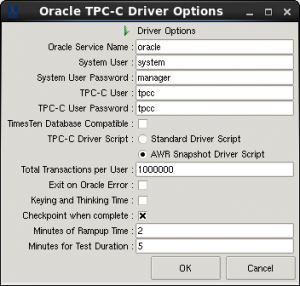
Consequently depending on the contents of the other redo log files a log switch checkpoint could be triggered at the end of a 25GB redo log file every minute and therefore a redo log size of 250GB in size would be configured for a 10 minute test. Use the views v$LOG and V$LOGFILE to correctly size the redo logs. Note that if you select “Checkpoint when complete” in the Driver Options a full checkpoint and a redo log switch will be triggered after a test is complete, resetting Oracle to start the next test at the start of the next redo log file in sequence.
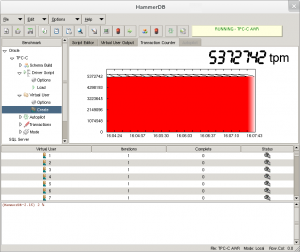
As shown observe performance for an entire test to ensure that the transaction counter is level showing that Oracle performance is consistent without a drop in performance for checkpoints.
Monitoring
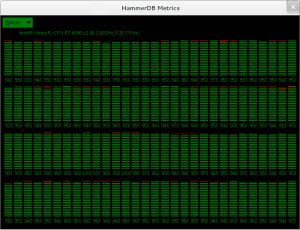
HammerDB Metrics provides a reliable way to monitor CPU performance on every core in your system. Maximum performance will be achieved when every core is fully utilised as shown in Figure 4. However it is not necessarily the case that full utilisation means maximum performance has been achieved. It is possible for misconfiguration to mean that CPU utilisation is high yet throughput is low due to contention.
HammerDB provides the facility to automatically generate AWR reports that correspond with the OLTP workload. Therefore these AWR reports should be your primary tuning tool to ensure that your Oracle environment is correctly configured. As shown the first point if reference should be the Top Foreground Events and you should aim for DB CPU as a percentage of time over 90% as shown to coincide with the OS report of CPU utilisation as shown in Figure 4 with HammerDB Metrics.
Top 10 Foreground Events by Total Wait Time
|
Event
|
Waits
|
Total Wait Time (sec)
|
Wait Avg(ms)
|
% DB time
|
Wait Class
|
|
DB CPU
|
30.1K
|
96.9
|
|||
|
library cache: mutex X
|
936,935
|
364.2
|
0
|
1.2
|
Concurrency
|
|
cursor: pin S
|
210,234
|
315.5
|
2
|
1.0
|
Concurrency
|
|
enq: TX – row lock contention
|
212,383
|
228.2
|
1
|
.7
|
Application
|
|
log file sync
|
28,919
|
82.3
|
3
|
.3
|
Commit
|
|
latch: In memory undo latch
|
693,091
|
82.3
|
0
|
.3
|
Concurrency
|
|
db file sequential read
|
55,642
|
46.4
|
1
|
.1
|
User I/O
|
|
buffer busy waits
|
222,183
|
23.5
|
0
|
.1
|
Concurrency
|
|
latch: enqueue hash chains
|
11,122
|
14.1
|
1
|
.0
|
Other
|
|
SQL*Net message to client
|
13,132,309
|
12.1
|
0
|
.0
|
Network
|
If this is not achievable use the rest of the AWR report to diagnose performance, in particular as shown CPU time and elapsed time should be checked to be as close together as possible for maximum efficiency. If not then it is necessary to determine the reason why this is not the case ans what accounts for the additional elapsed time.
|
CPU Time (s)
|
Executions
|
CPU per Exec (s)
|
%Total
|
Elapsed Time (s)
|
%CPU
|
%IO
|
SQL Id
|
SQL Module
|
SQL Text
|
|
15,894.75
|
5,704,467
|
0.00
|
52.73
|
19,048.04
|
83.45
|
0.01
|
wish8.6@wesep1.example.com (TNS V1-V3)
|
begin neword(:no_w_id, :no_max…
|
|
|
3,663.11
|
571,496
|
0.01
|
12.15
|
3,946.36
|
92.82
|
0.00
|
wish8.6@wesep1.example.com (TNS V1-V3)
|
BEGIN delivery(:d_w_id, :d_o_c…
|
|
On very high performance systems if contention is observed in the library cache then the markhot package can be used to reduce this.
More posts are planned on advanced performance tuning.


How do I connect HammerDB to an Oracle Cloud database which requires a wallet to log into DB? Specifically I’d like to connect HammberDB to an Oracle Autonomous Database to perform TPCC and TPCH workload simulations.