An essential part of database performance testing is viewing the statistics generated by the database during the test and in 2009 HammerDB introduced automatic AWR snapshot generation for Oracle for the TPC-C test. With this feature Oracle generates a wealth of performance data that can be reviewed once the test is complete. However what if you want to review performance data in real time as the test is running? With HammerDB 3.1 you can now do that with Oracle Metrics.
Before introducing how this works it is important to acknowledge the ASHMON tool from which this functionality was adopted and more importantly its author Kyle Hailey for giving permission to add it as open source.
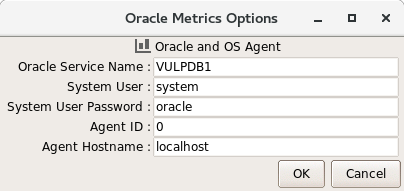
To get started with Oracle metrics use the previous option for CPU metrics that now shows the service name and system user and password.
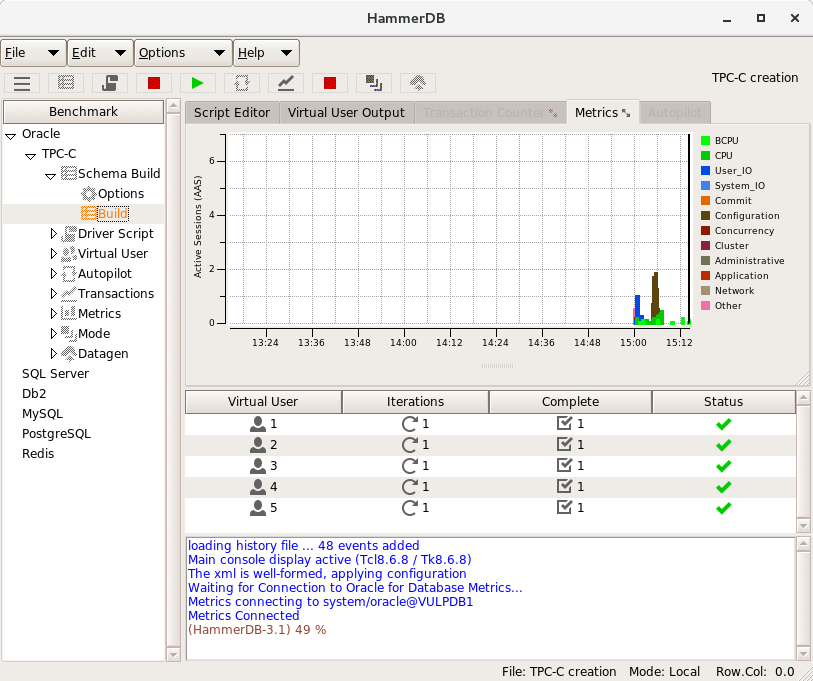
With these filled out click the metrics button and once connected to the Oracle database the metrics window will appear embedded within HammerDB.
you can either resize the window embedded using the grab bar or you can grab the tab at the top of the notebook that says Metrics (with the arrows indicator) and drag the window out to be standalone (closing the window embeds it again).
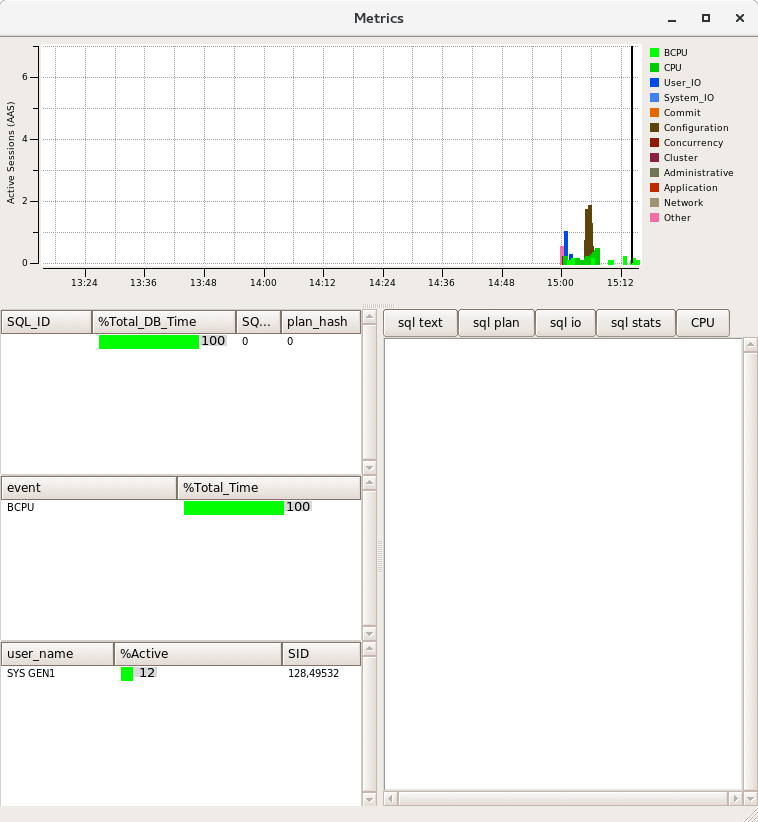
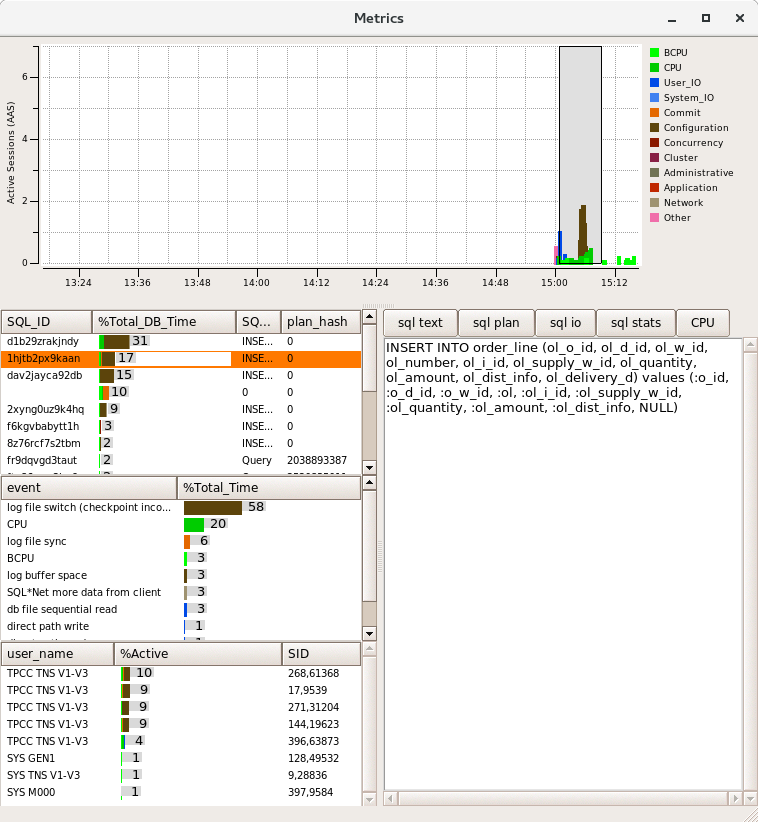
As this feature uses the Oracle Active Session History, use the mouse to highlight a timeframe of interest and the SQL, wait events and users will appear in the panes to the left. On the right you have the choice of displaying the sql text, explain plan, io or statistics. The CPU option allows you to view the original live CPU metrics window. It is clear from the window below that HammerDB was running a schema build and the top wait event was log file switch (checkpoint incomplete) – time to resize the redo logs or move them to faster disk!
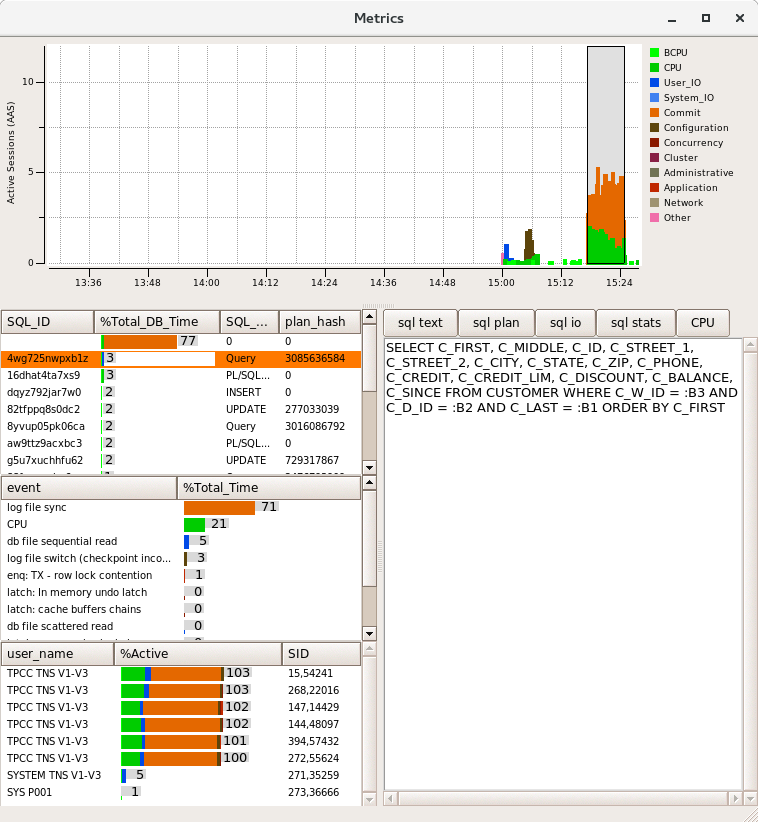
Running a TPC-C performance test information can be viewed live (by not selecting an area) or by highlighting the area of interest. In this example a test with 2 minute rampup and 5 minute test time can be seen. It is also clear that most significant wait event is “log file sync” and therefore tuning should focus on the redo log performance. The user CPU is highlighted in green and the aim for maximum performance is for the top event to be CPU.
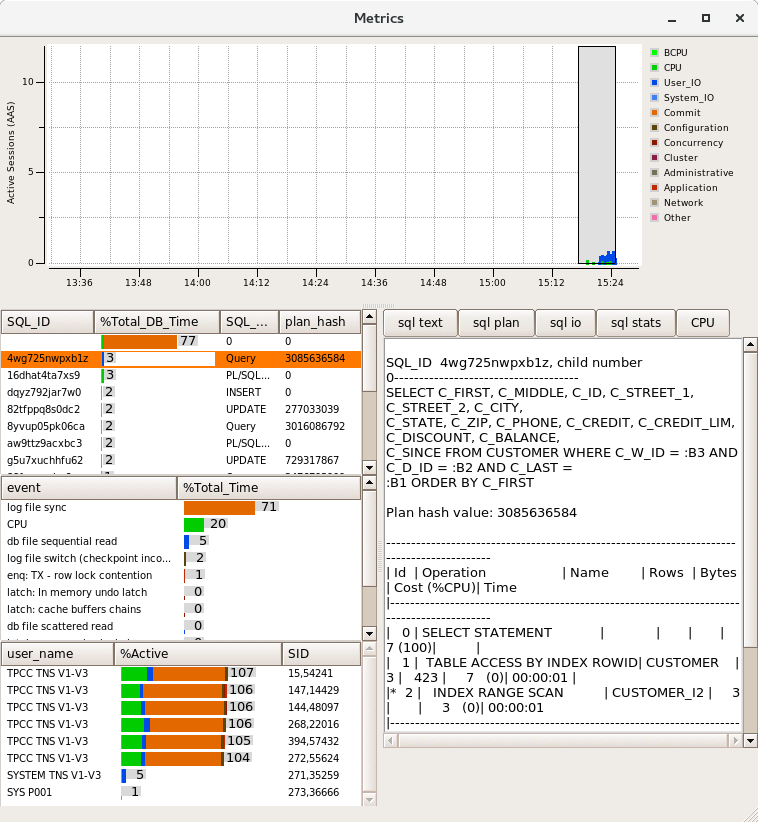
You can also drill down on particular SQL ID’s be double clicking on them that will highlight the related wait events and in this example the session showing the most “db file sequential read” is highlighted with the associated explain plan showing the index access that we would expect.
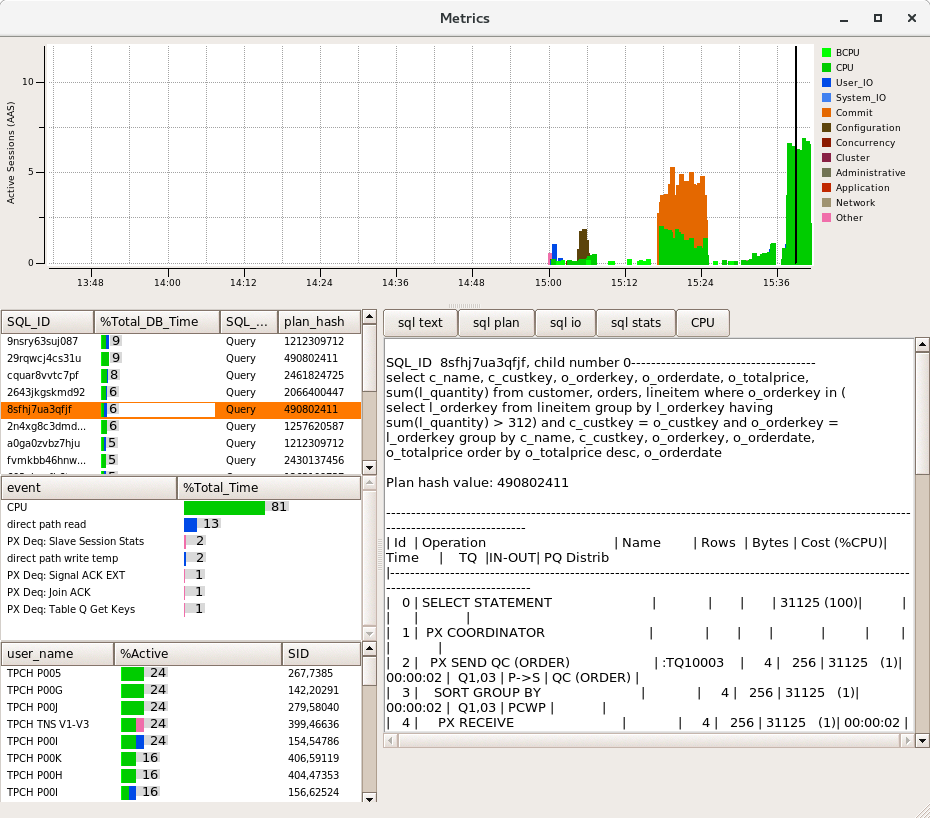
All of this functionality is also available for the TPC-H workload as well so you can see the actual queries how they were run, the explain plans and the events.
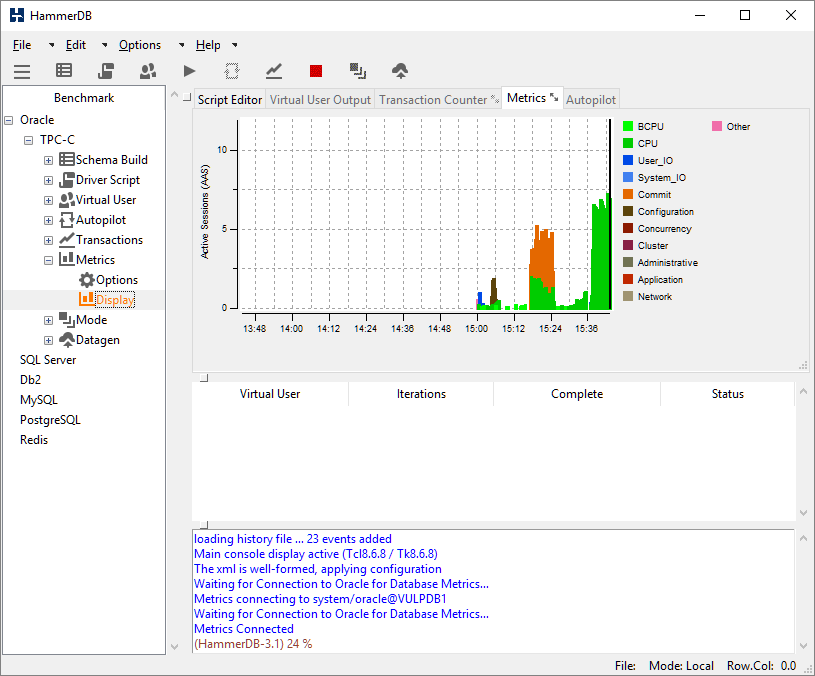
Finally like all HammerDB features everything that is available on Linux is equally available on Windows as well so if running an Oracle client on Windows you can access exactly the same features to monitor your benchmark performance in real time.


