
In this post, we will look at the findings of a blog post by EnterpriseDB analyzing a HammerDB workload against PostgreSQL using Postgres Workload reports. We will provide a brief summary of the article and its conclusions, and demonstrate a better way to analyze PostgreSQL performance with HammerDB itself. We will then highlight the errors that have been made in the EnterpriseDB article and the reasons why.
How Postgres Workload Reports Help Optimize Database Operations
The EnterpriseDB blog post can be found here, How Postgres Workload Reports Help Optimize Database Operations.
An excellent point that the author makes is that special attention should be given to two specific items: the actual_start_snap_ts (2024-02-15 07:44:18.588779+00) and the actual_end_snap_ts (2024-02-15 07:54:16.587401+00)… This indicates that the database is being evaluated over a 10-minute period. We will remember this point as it gives an indication of the common error made when using analysis based on snapshot type workload reports (we have seen the same error with Oracle AWR reports).
The key findings of the article were as follows:
- This server had a HammerDB benchmark running against it. One possibility – and in this case, the most probable conclusion – is that the client test machine was overwhelmed and could not respond to the server fast enough.
- The client was waiting for user input, such as a return from a prompt.
It doesn’t mean that something on the server is impacting the system’s throughput. Instead, the issue is with the client.
And the SQL with the highest wait time in the ClientRead wait event was the following:
COPY stock (s_i_id, s_w_id, s_quantity, s_dist_01, s_dist_02, s_dist_03, s_dist_04, s_dist_05, s_dist_06, s_dist_07, s_dist_08, s_dist_09, s_dist_10, s_data, s_ytd, s_order_cnt, s_remote_cnt) FROM STDIN WITH (FORMAT CSV)
An example PostgreSQL manual at AWS gives an indication of why a COPY operation might result in a ClientRead wait event.
During a copy operation, the data is transferred from the client’s file system to the Aurora PostgreSQL DB cluster. Sending a large amount of data to the DB cluster can delay transmission of data from the client to the DB cluster.
But why are we running a COPY operation during a benchmark anyway? To investigate further, we will analyze PostgreSQL performance using HammerDB built-in tools for a deeper insight into the workload.
(Note, we are using the new awbreezedark theme to be introduced with HammerDB v4.13).
Setting up pgSentinel
HammerDB PostgreSQL metrics is based on a superb tool called pgSentinel that brings active session history functionality to PostgreSQL. An active session history allows us to look back at a database workload and see the workload being run over time. Note that this is in contrast to a snapshot/report type functionality that shows us an average of the workload over a period of time, such as 10 minutes. The active session history instead allows us to drill down into specific time periods of interest.
To use pgSentinel we have installed pg_stat_statements and pgsentinel and added the following to our postgresql.conf.
shared_preload_libraries = 'pg_stat_statements,pgsentinel'
track_activity_query_size=2048
pg_stat_statements.save=on
pg_stat_statements.track=all
pgsentinel_pgssh.enable = true
pgsentinel_ash.pull_frequency = 1
pgsentinel_ash.max_entries = 1000000
Building the HammerDB schema
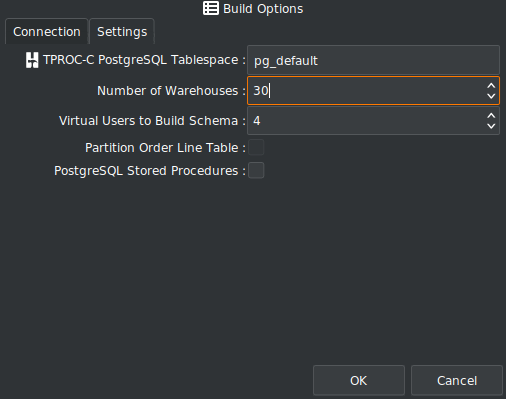
Before we run the workload, we need to install the schema, so for this example running locally on a laptop we are going to configure a 30 warehouse schema with 4 Virtual Users.
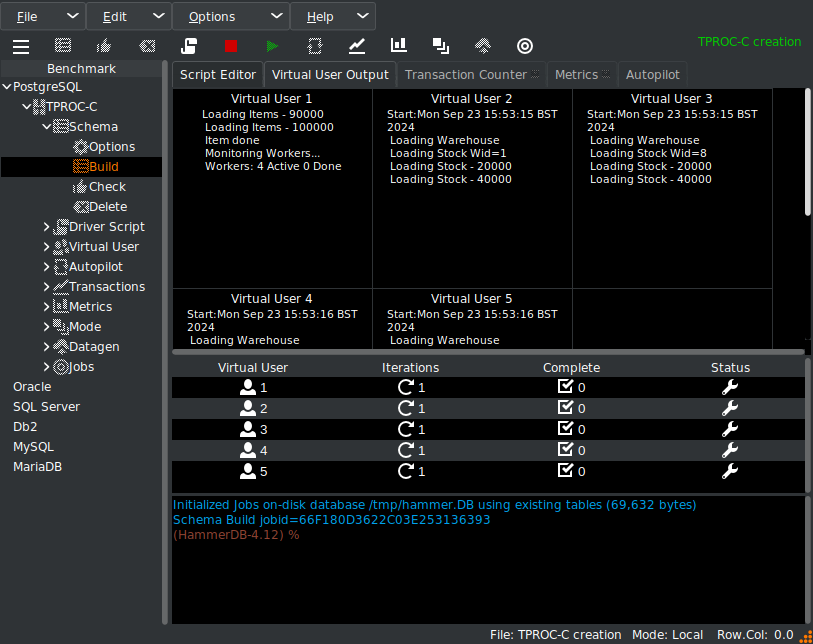
and start the build running.
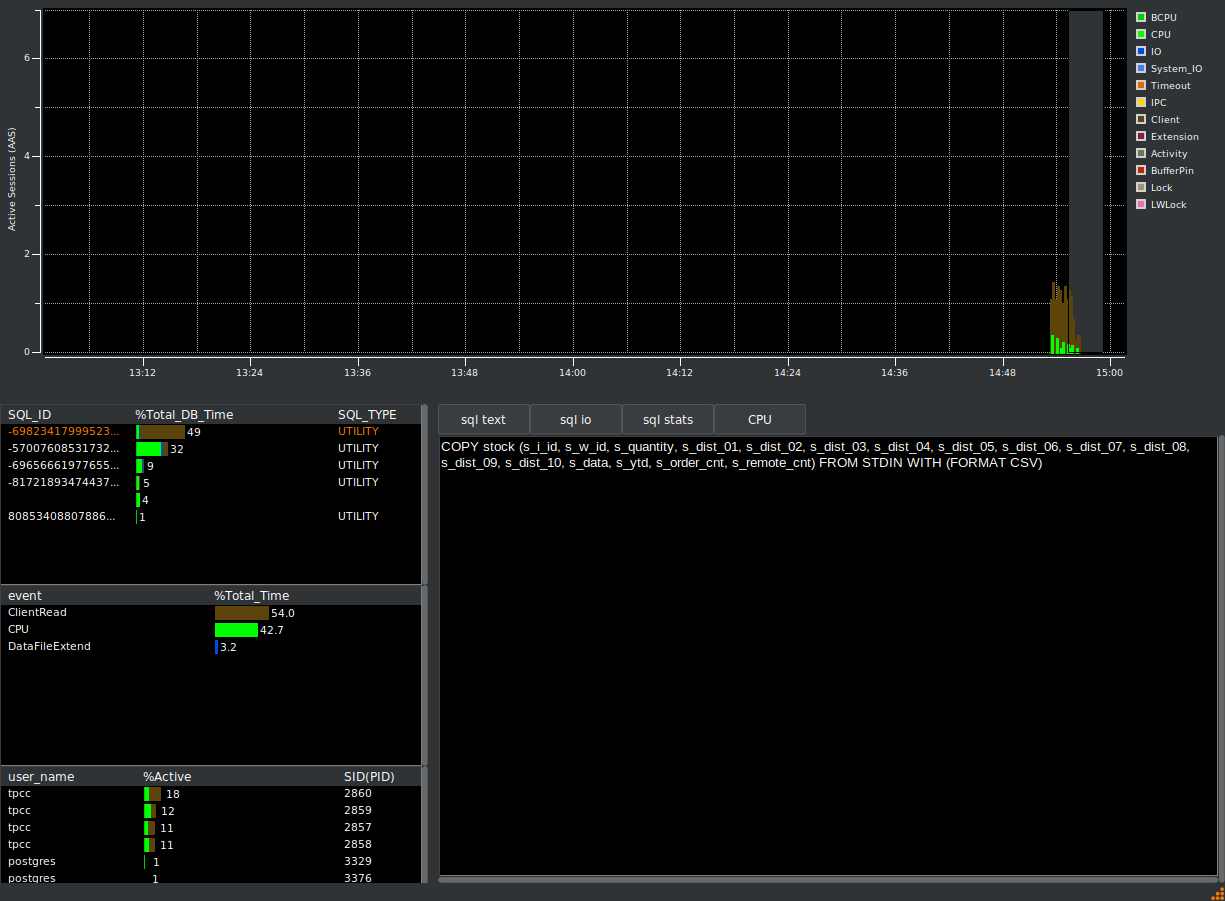
Press the HammerDB metrics button to start the HammerDB PostgreSQL metrics, collection, grab the Metrics tab in the notebook display, drag it outside the main window and expand to reveal all the metrics being collected over time. Note if you only have browser access to a remote server you can run HammerDB through the browser, so this functionality is available in all environments.
The first thing we see in real time is we have on average 2 active sessions, waiting 100% of the time on ClientRead and the SQL it is waiting on is the same COPY stock statement we saw from the EnterpriseDB blog post. (click on the image to expand for a detailed view).

So this COPY statement is coming from the schema build phase and not the HammerDB benchmark workload at all. It should be clear as shown in the manual that if we are running a COPY statement and transferring a large amount of data, we should expect to spend a lot of time waiting for the client to send that data. The client is not ‘overwhelmed’ at all, this is normal when running a COPY statement.
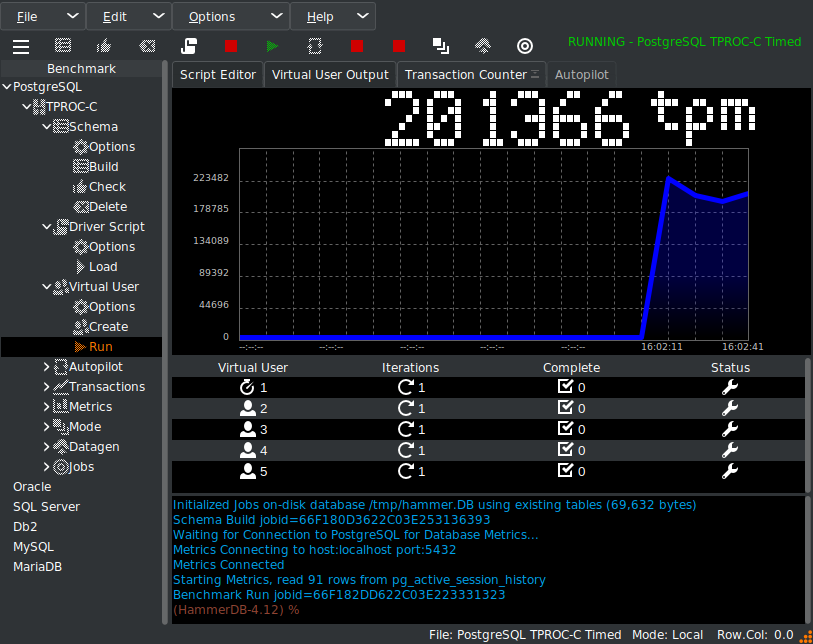
Running the HammerDB benchmark
Once the schema build has completed, we run the HammerDB benchmark workload itself.
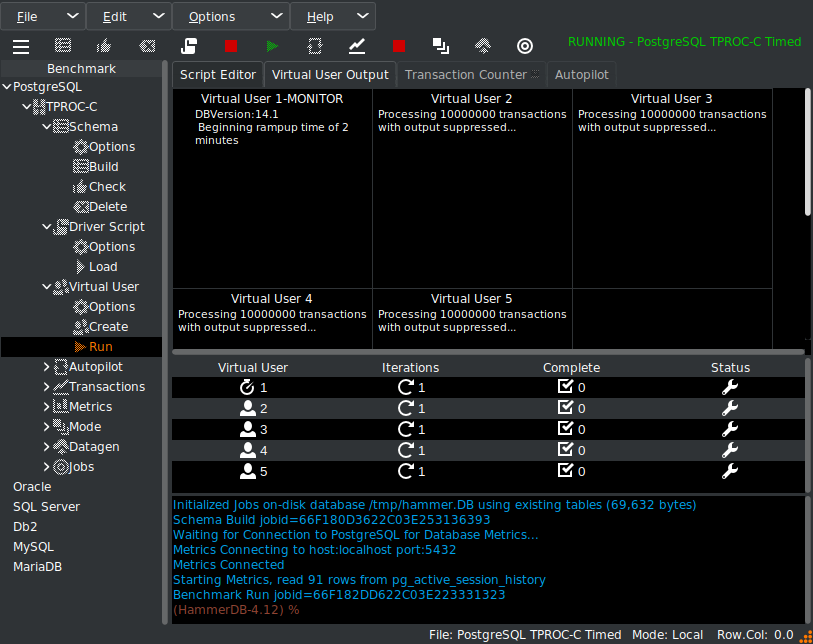
and checking with the transaction counter, we can see we are now running a workload against the PostgreSQL database.
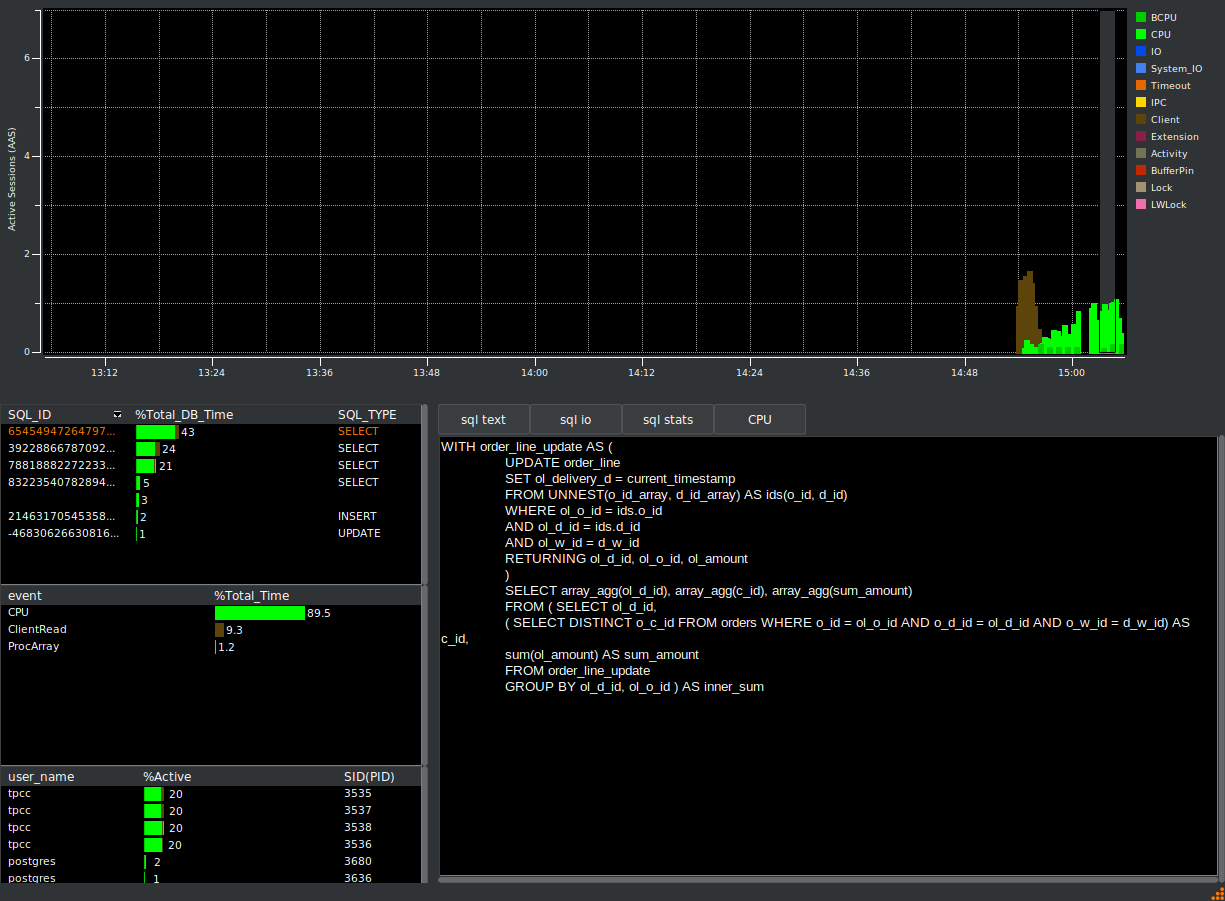
Now if we head back to the HammerDB metrics we will use the selection box in the graph to select a period of time when we are running the benchmark workload rather than the build. It should be clear from the graph itself that although the build is dominated by the ClientRead wait event, now we are running the workload most of our time is spent in foregound CPU and the top SQL is related to the benchmark workload and not the build.
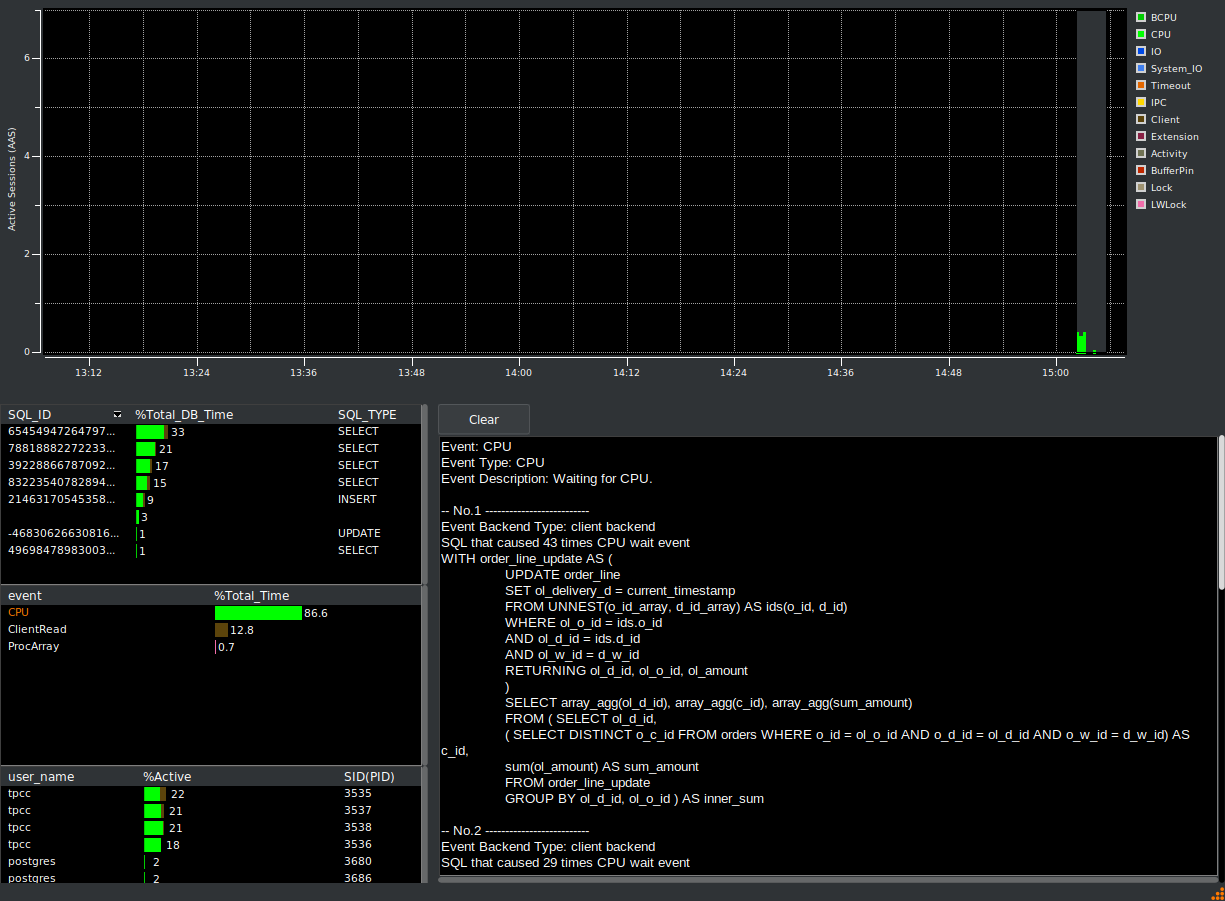
If you click on the CPU event, it will also report the SQL that causes most occurrences of that event, which of courses matches with the top SQL shown first.
If you close the metrics window, it will reattach to HammerDB, experts can use this view for a quick oversight of the wait events experienced by the database.
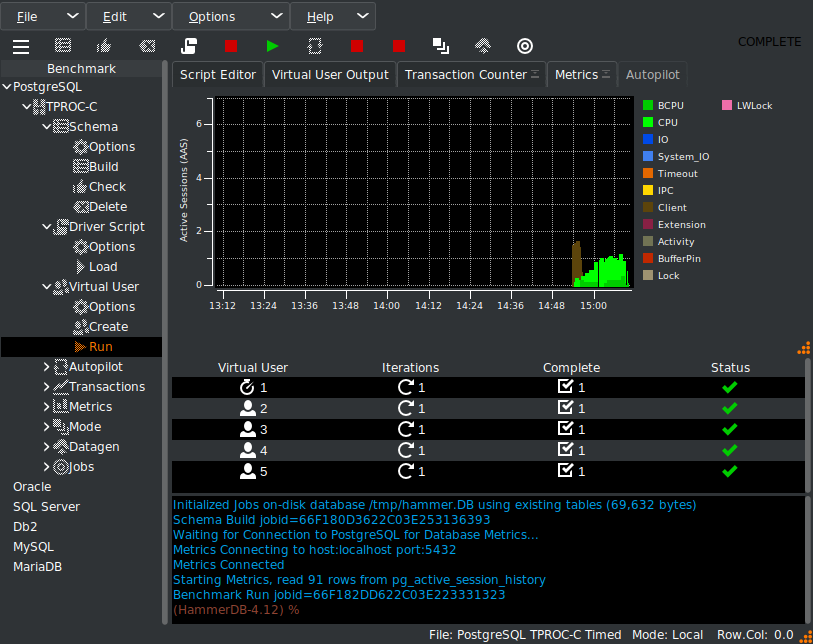
When the workload has completed, HammerDB reports the performance.
Analyzing PostgreSQL performance
So, now it should be clear, the error made by EnterpriseDB in analyzing PostgreSQL performance using workload reports. The clue is in the special attention paid to the 10-minute period of the workload report. It is highly likely that in this period of time they ran a schema build and a benchmark workload and then mistakenly attributed the build wait events to the workload and reached the wrong overall conclusion (that the client test machine was overwhelmed and could not respond to the server fast enough). Of course, we already know this will not be the case in advance because we use stored procedures to ensure that the workload runs on the server and not the client.
We have learned an important aspect of snapshot type workload reports. Firstly, they show an average of all the work taking place on a database over a period of time, so as in this case if you have 2 separate scenarios (such as schema build and benchmark) in this time period the overall report can be confusing. Secondly, snapshot workload reports are relative. The wait events they show are only relative to the work taking place at that time, so for example, a report from an idle system may have the DBA diagnosing obscure housekeeping related wait events as the DBA taking the snapshot has missed the crucial workload. When using snapshot type reports, pay close attention to what the workload should be that you think you are capturing and clues that you could have made an error.
Instead, using pgSentinel for an active session history approach shows the active sessions over time and their wait events, making it easier to determine that different workloads have been running consecutively.
Summary
We looked at the blog post How Postgres Workload Reports Help Optimize Database Operations by EnterpriseDB and saw how using a workload report to analyze a HammerDB workload resulted in an incorrect conclusion. We then presented the HammerDB alternative based on pgSentinel and an active session history approach to illustrate that it was likely EnterpriseDB attributed the wait events from a HammerDB schema build to a benchmark run, thereby reaching this incorrect conclusion.
Of course, workload reports and the active session history complement each other in diagnosing database performance, however with workload reports it is especially important to know what workload is running on the database during the snapshot interval. For example, with the HammerDB Oracle workload a snapshot for an AWR report is taken automatically after the ramp-up period is complete to ensure that the report only shows the database metrics for the workload period.